Global Methane Budget: No “Methane Bomb” in the Arctic YET. Risk is RISING // Jul 27, 2020
The latest science on the Global Methane Budget was recently published in a landmark paper authored by over 70 multidisciplinary scientists. No methane bomb has ignited yet in the Arctic; for latitudes 60 to 90N methane emissions are 4 percent of the total budget as of 2017.
About 2/3 of methane emissions are from latitude 90S to 30N, mostly from tropical equatorial regions.
The remaining 1/3 of methane emissions are from latitude 30 to 60N. Atmospheric methane concentration is rapidly rising, mostly from 2 sources; namely from agriculture and fossil fuels.
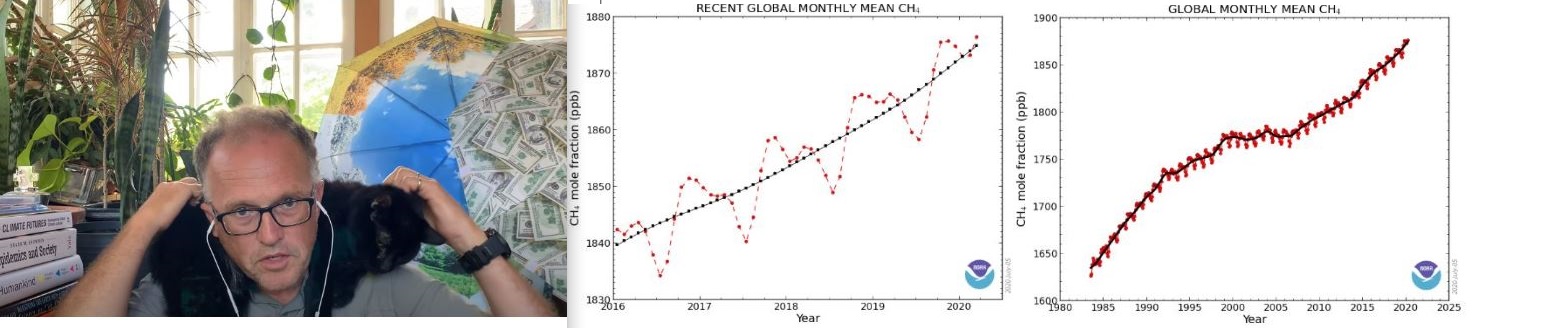
Global Methane Budget: Rapid Atmospheric Methane Rise Mostly From Agriculture and Fossil Fuels // Jul 27, 2020
Recent papers on the Global Methane Budget are vital reading. Atmospheric methane concentration is rapidly rising from 2 main sources; namely agriculture (mostly livestock) and fossil fuels (mostly fracking).
Two basic approaches to study methane exist;
1) Bottom Up (BU) – individual gas sources are summed up to get total emissions, and
2) Top Down (TD) – satellite based sensors measure the atmospheric methane in columns of air and sum the individual readings to get a total.
Since the start of the industrial revolution in 1750 the cumulative methane forcing is about 25% of the total, which is dominated by CO2.
— Dr. Genevieve Guenther (@DoctorVive) July 26, 2020
———- ———-
Please consider donating to support my work. I put a lot of time and effort into researching, studying and producing my videos so that you can learn how quickly our world is changing. Donating does not need a PayPal account, but simply a credit card. Please click here.
———- ———-
“Since the beginning of June this year, the floods have impacted more than 45 million people in 27 of China’s provinces, exacting an economic cost of more than 116 billion yuan ($16.5 billion).” https://t.co/ATPMpvrGIQ
— David Wallace-Wells (@dwallacewells) July 26, 2020
Exposed to a sick American bullfrog tadpole, a healthy tadpole will do its best to stay away. Garden ants and even lobsters also know to stay away when one of their own is sick.
Trump has sent more than 40 tweets in the last couple of hours- mostly to make his case for his failing fascist takeover of Portland. He has finally figured out his storm trooper gassing the suburban women he needs to win the election was not his best strategy.
Updating the Climate Science: Truth and Consequences: 1 of 3 // Jul 17, 2020
Dr James E. Hansen is one of my climate heroes. He tried to tell the world about the grave threat of climate change by testifying to the US Congress in 1988 but nobody wanted to listen. Ten years ago he wrote the totally awesome book “Storms of my Grandchildren”.
He and his team diligently update numerous graphs on global energy, global temperature, solar activity, greenhouse gas levels and rates of change, ENSO cycles, global precipitation and drought, wind, hurricanes, tornadoes, wildfires, sea level, Greenland and Antarctica ice sheet loss, butterflies, forcings, aerosols, and paleoclimate. Have I missed anything:)?
Fossil Fuel CO2 Emissions and Energy Use: Energy Consumption (last modified 2020/06/25).
———- ———-
Updating the Climate Science: Truth and Consequences: 2 of 3 // Jul 17, 2020
I continue chatting on James Hansen climate graph updates and key findings.
Global emissions continue rising,
exceeding 10 PgC/yr (Gt/yr), with the airborne fraction from 45 to 64%.
Atmospheric CO2 growth is about 2.5 ppm/yr (5-year mean) spiking over 3 ppm/yr some years.
Global surface temperature relative to 1880-1920 mean is 1.3C (add 0.3 for 1750 baseline).
Land surface temperature rise is about double that of sea surface temperature rise.
Northern Hemisphere warming anomaly is greatest in autumn, then winter, then spring and least in summer.
Siberia is gonzo.
Solar irradiance is at a minimum in sunspot cycle.
———- ——— Updating the Climate Science: Truth and Consequences: 3 of 3 // Jul 17, 2020
Global temperature in 2020 is exceeding the record set in powerful El Niño event 2015-2016, in spite of it not being another El Niño year.
Global precipitation mayhem results in torrential rains with huge floods in some regions and extreme droughts in other regions (both bad for crops).
Number of powerful Category 3 to 5 Atlantic hurricanes is trending upwards, as is number of top end tornadoes.
Wildfire average is increasing, correlated with temperature anomalies.
Sea level rise is accelerating, with Greenland and Antarctica ice mass loss rates doubling every 10 years.
Arctic sea ice is getting crushed like a bug.
———- ———-
Here we go again…
Scorching hot within the Arctic circle next week.
Youl could stand in the heat and look over the Arctic ice. Oh wait, you can't. It has melted 2 months earlier than what would be considered normal in the 1980s.
Please consider donating to support my work. I put a lot of time and effort into researching, studying and producing my videos so that you can learn how quickly our world is changing. Donating does not need a PayPal account, but simply a credit card. Please click here.
———- ———-
Parts of #Arctic Siberia observed temperatures up to 8°C above average last month
In this #Arctic sea ice graph we see 89 model runs from about 36 CMIP5 models under a high emission RCP8.5 scenario. Dotted line is 1 million sq. km. (virtually ice-free). Thick black line is observed. Thick red line is extrapolation trends from 1998 through 2012 record low. pic.twitter.com/AIQg7pIpad
Warm Weather Thunderstorms are Bizarrely Occurring in the High Arctic Near the North Pole // Jul 10, 2020
The Arctic has warmed so fast that warm weather thunderstorms now occur in the Arctic reaching a record latitude of 85 degrees North. Lightning has been detected within 500 km (300 miles) of the North Pole; some lightning is amazingly occurring directly over sea ice.
The height of the lowest part of the atmosphere (troposphere) is only 7 km high in the Arctic (17 km at equator; global average 11 km), and acts as an upper cap on heights of cumulonimbus storm clouds (anvil top is at tropopause). Clearly, the 7 km limit is not stopping these Arctic thunderstorms.
—————–
At first guess I would have said coastal flooding… but he says it's from rain. The rain was torrential! https://t.co/vwvs5KGeJM
Please consider donating to support my work. I put a lot of time and effort into researching, studying and producing my videos so that you can learn how quickly our world is changing. Donating does not need a PayPal account, but simply a credit card. Please click here.
———- ———-
OMG: “Fauci last saw Trump in person at the White House on June 2 — and says he has not briefed the president for at least two months.” #TrumpGenocidehttps://t.co/EVSlZZ5gFn
1/3 of Americans missed July housing payments, 1/5 made NO payment in first week. Apocalyptic evictions on the horizon, US political class is paralyzed, oligarchy getting richer by the day—while liberal media nomenklatura obsesses over cancel culture. https://t.co/qGeklg0jbm
A new "unknown pneumonia" that is potentially deadlier than the novel coronavirus has reportedly killed more than 1,700 people this year in the Central Asian country of Kazakhstan, according to a warning issued by Chinese officials https://t.co/w2ZZgprCxs
New UN Report on Electronic-Waste: e-waste: We think we can throw something AWAY. There is no AWAY // Jul 2, 2020
I was just on CTV News talking about major findings within a brand new UN report released today titled “Global e-waste Monitor 2020”, and I decided to make a video. Globally, in 2019, we dumped a record 53.6 million tons of e-waste, equal to the weight of 350 Queen Elizabeth 2 cruise ships.
Inside this waste was:
$57 Billion in platinum, gold, silver, copper and other high value components;
as well as many toxic substances such as mercury that are extremely harmful to human health and the environment.
This is unsustainable. We must do Cradle-to-Grave product design, and stop planned obsolescence of products.
———- ———-
High Risk of Simultaneous Crop Failures in North America, Europe, and Asia From Stuck Jet Streams // Jul 3, 2020
With Abrupt Climate System Change, we are hit with worsening, severe, increasingly grave consequences. When the Jet StreamRossby Waves get stuck in persistent quasi-resonant locking patterns with wavenumbers 5 and 7 (i.e. 5 and 7 wavelengths: a ridge H and a trough L is one wavelength cycle) circumventing the planet then crucial agricultural regions in North America, Europe, and Asia have lower yields. This jet stream resonance with Earth (from topography and land-ocean temperature contrasts) causes simultaneous crop failures spiking food prices causing geopolitical conflict and mayhem.
———- ———-
Editor (dk): We had promised awhile back, a very good friend of ours in climate work and alert, to share his work to Paul’s site, but failed to do so. We hope to remedy that, here. JimTanya Qually-McHenry who has been holding Climate Rallies weekly in Gettysburg Pennsylvania, of all places. They are outstanding. Besides having, and please forgive us if we recollect poorly, taught history in Public Schools, Jim is very lucid and on point. He has been tireless in his message. Besides that, he is an extraordinarily accomplished lifetime runner, with many top or winning finishes in Seniors in the Marathon, at the National Level.
His most recent video, came out today. You must view this, at Facebook: ‘Climate Change Emergency Protest #82‘: ‘The Arctic’, July 3, 2020 Gettysburg PA US
———- ———-
California hosts the world’s oldest tree, the world’s tallest tree, and the world’s largest tree, when its forest cover is 17.8% of its territory (35th state in the U.S. per forest cover) https://t.co/byxxI4QBC3pic.twitter.com/o6d432dvd8
I was just on CTV News talking about major findings within a brand new UN report released today
Please consider donating to support my work. I put a lot of time and effort into researching, studying and producing my videos so that you can learn how quickly our world is changing. Donating does not need a PayPal account, but simply a credit card. Please click here.
———- ———-
For years I have been saying that #Arctic temperature amplification is 3 to 5 times global average temperature. This justifies it…pic.twitter.com/KnnDM9ucjE
I trawled through the SAGE meeting minutes with a fine-tooth comb to find out what happened to the Government's decision-making as the #COVID19 crisis kicked off. What I found wasn't pretty. Here's my exclusive investigation via @BylineTimeshttps://t.co/edMeDgmEpA
— Dr Nafeez Ahmed FRSA (@NafeezAhmed) July 3, 2020
Trump quietly canceled the rest of his campaign rallies yesterday. He’ll cancel the debates as well. In both, he would just embarrass himself, and he knows it. Until then, he’ll hide in the bunker while Americans are sick and dying, watching cable tv and tweeting crap. 124 days.
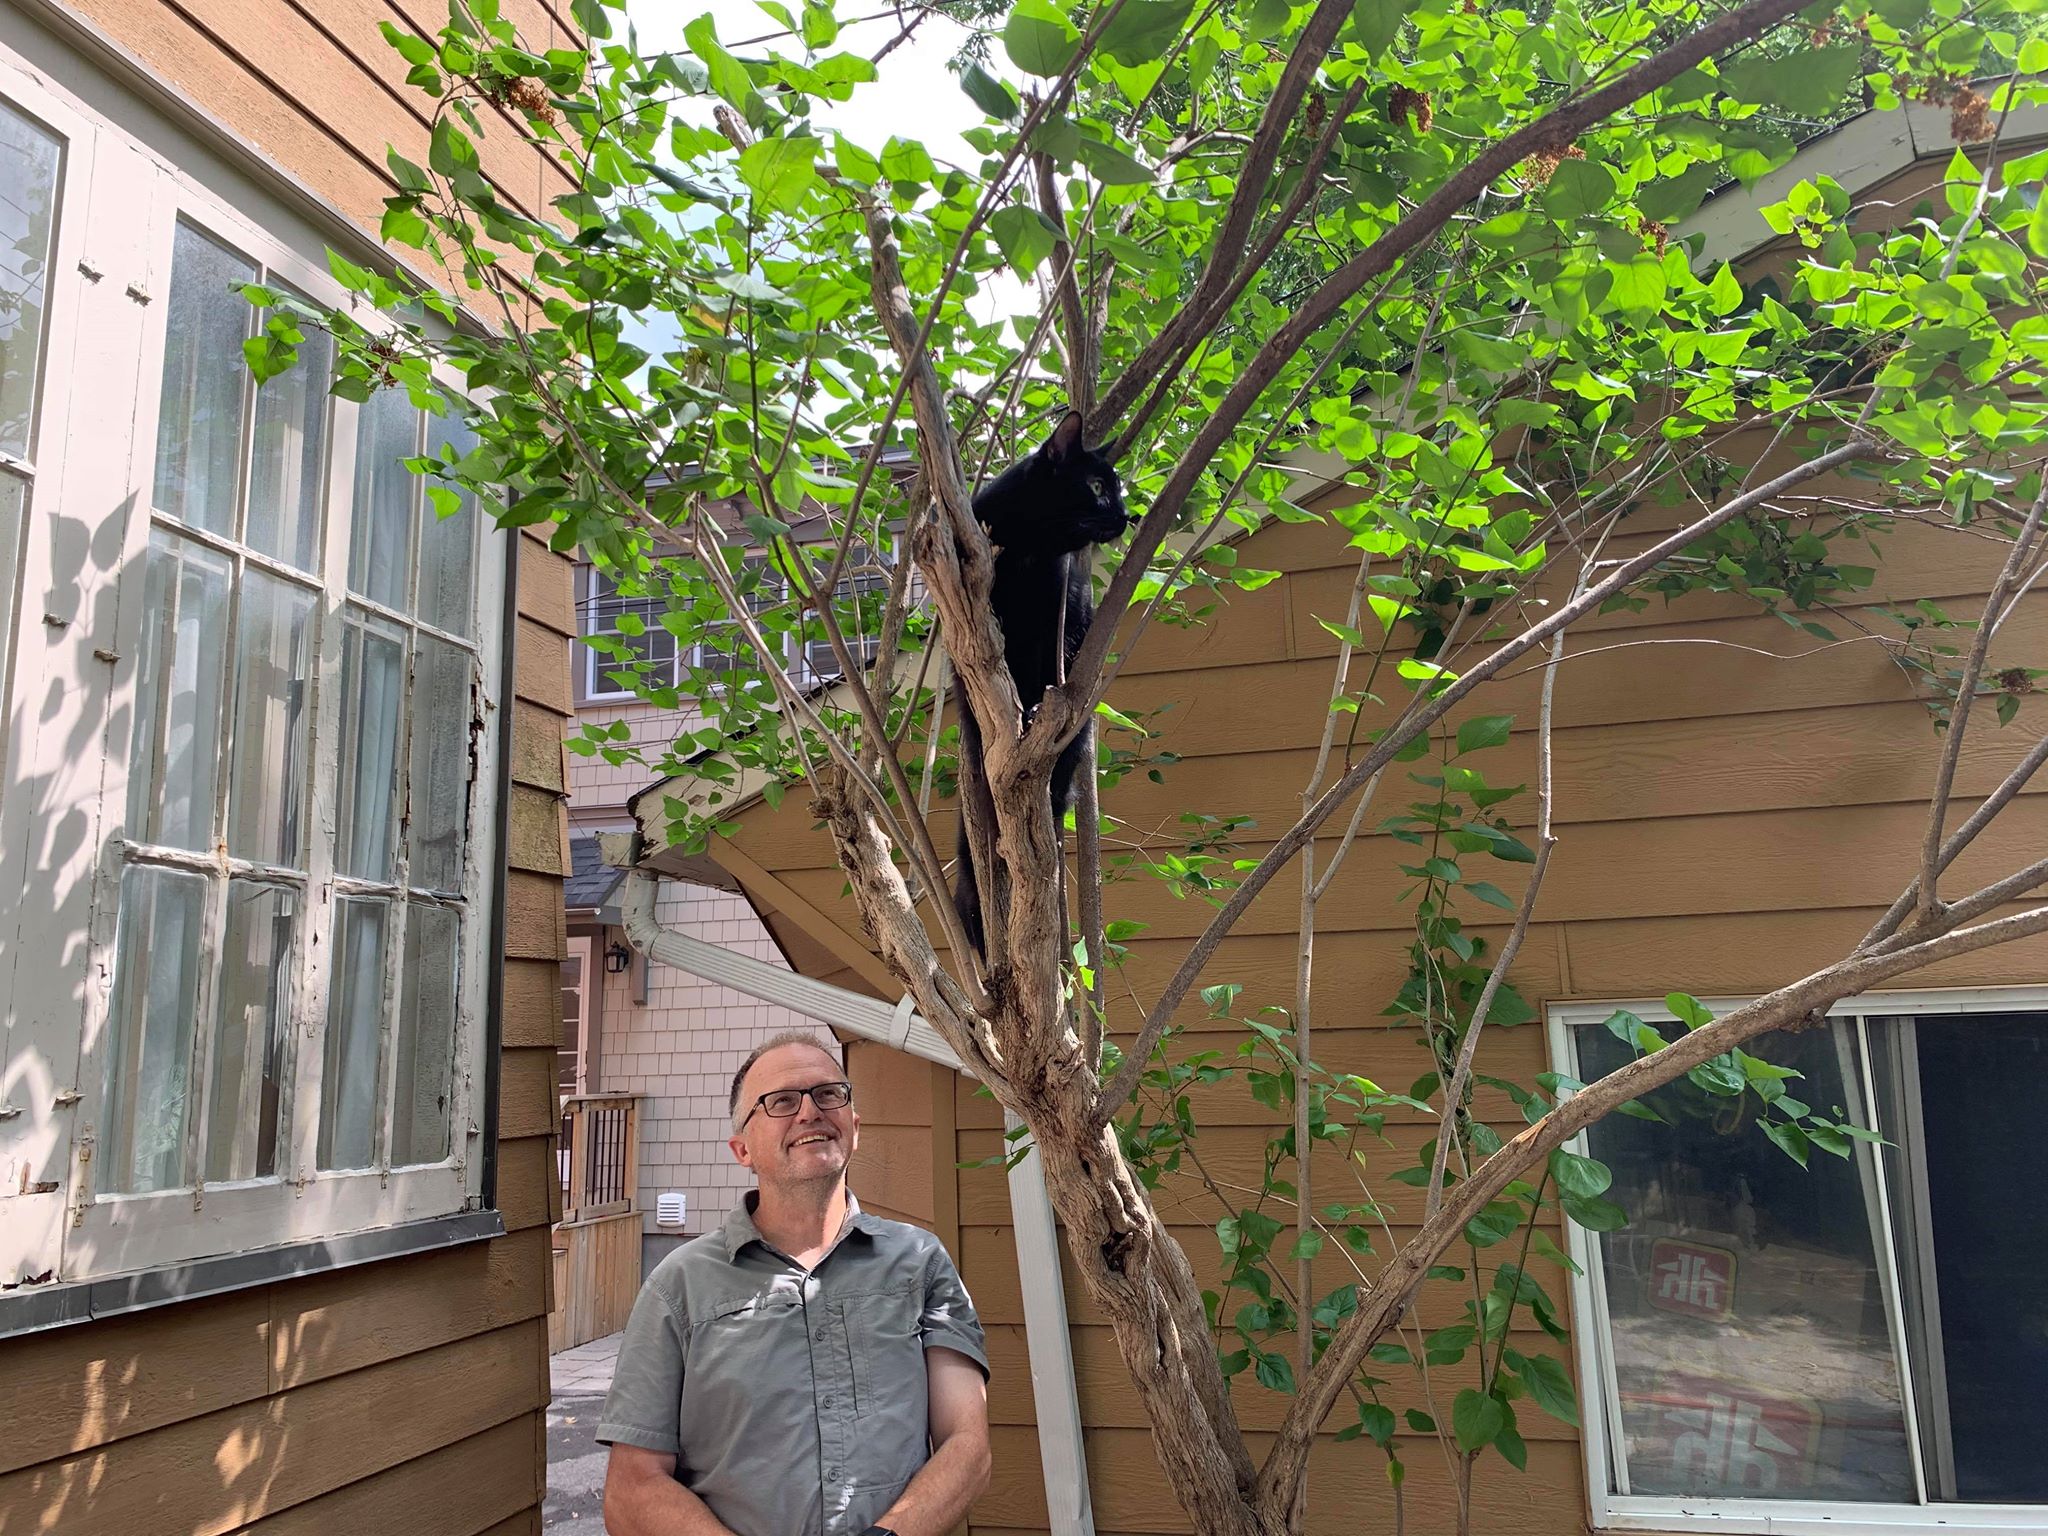
Just waiting for donny to tweet so I can play show and tell with him again today. I wonder how many times I can share this pic today? I shared a little last night, but now I have all day. @realDonaldTrumppic.twitter.com/ne5iaMumHC
My son Neil put him in the tree low down, and Shack wanted to go higher. Neil then took the photo, and climbed on a chair to get him down. He seemed to like it up there; he trusts us:) He is normally an indoor cat, but very adventurous!
I am training him to go backwards down a tree; cats cannot normally do that, and thus get stuck. The tree is like a one way street to them; up only… ———- ———-
Teaser: Global Food Supply at RISK from Simultaneous Crop Losses Due to Specific Jet Stream Patterns // Jun 29, 2020
I have perfect timing starting this video. My face is illuminated by lightning and then seconds later you hear the thunder. Pop Quiz: How far away was the lightning bolt? A while ago, Michael Mann and others published a paper on how jet streams tend to get amplified and stuck in a persistent, quasi-resonance with wavenumbers 6 to 8 (Ridge-Trough wave pattern repeats 6 to 8 times around the Earth) .
I introduce you now to a new paper that finds modes 5 and 7 can cause simultaneous crop reductions in vital farming areas in North America, Europe, and Russia. This is obviously a huge threat to our global food supply.
Ref: Influence of Anthropogenic Climate Change on Planetary Wave Resonance and Extreme Weather Events, Mann, Rahmstorf, Kornhuber, Steinman, Miller & Coumou: Published: 27 March 2017:
‘Persistent episodes of extreme weather in the Northern Hemisphere summer have been shown to be associated with the presence of high-amplitude quasi-stationary atmospheric Rossby waves within a particular wavelength range (zonal wavenumber 6–8). The underlying mechanistic relationship involves the phenomenon of quasi-resonant amplification (QRA) of synoptic-scale waves with that wavenumber range becoming trapped within an effective mid-latitude atmospheric waveguide.’
———- ———-
Punching Through the Front of a Storm as it Tracked from Ottawa to the US Border // Jun 29, 2020
Just for FUN; yesterday I spend 4 great hours in the car tracking a nice storm system from Ottawa southward to the US border, a distance of over 100 km (60 miles). There was no jet stream or wind shear to cause rotation, thus no tornadoes, however there was torrential rain with some hail.
My dashboard mounted camera picked up the action as I punched through the storm at the front side. You see beautiful skies, lots of rolling dark clouds and very detailed and majestic cloud structures that made my road trip a success.
———- ———-
More Science on Jet Stream Rossby Wave Blocks and Consequences to Humanity and Our Societies // Jun 24, 2020
I continue to chat on blocking changes under climate change acceleration, and how the consequences are very bad for humanity and societies. The number of people directly affected by blocking is proportional to the size of the region under the ridge which has been found to be proportional in turn to the thickness of the jet stream times the wavelength of the Rossby Wave modified by a curvature factor of the wave. Wave resonances of the jet stream Rossby waves with the land-ocean contrasts and the topography of the Earth (orography) can result in simultaneous crop failures, as I discuss in further detail in some videos to follow.
———- ———-
Persistent Quasi-Stationary Jet Stream Ridge Over Siberia a Perfect Example of Jet Stream Breakdown // Jun 23, 2020
As I explained previously, slowing, wavier jet streams (less West-to-East zonal winds; more North-to-South meridional winds) cause the likelihood of atmospheric blocks to be much greater.
The persistent quasi-stationary ridge in the Arctic over Siberia is extremely concerning, and will quickly accelerate degradation of Arctic Sea Ice, permafrost breakdown with associated methane emissions, and Greenland glacier melt with rapid sea level rise. I continue to chat about how blocking changes with rapid climate change acceleration, and how consequences of this change are very bad news for humanity and society.
———- ———-
Extremely hot again on the fringe of the Arctic Ocean.
An astonishing + 34 °C has just been recorded at a latitude of 73 °N today in Russia. This is about + 20-25 °C warmer than normal.
Note how much open water there is compared to normal. Sea ice is taking a hit. pic.twitter.com/y0w5PLjkHx
Please consider donating to support my work. I put a lot of time and effort into researching, studying and producing my videos so that you can learn how quickly our world is changing. Donating does not need a PayPal account, but simply a credit card. Please click here.
———- ———-
"Now, more than ever, we need to think differently. But just as important as imagining a better world is putting the actual work in to build it. That may feel hard, but as Holthaus notes, 'the old world is dead—what comes next is up to us.'” https://t.co/6lC4MKR1Wa
— David Wallace-Wells (@dwallacewells) June 30, 2020
South Pole warming 3x faster than the rest of the globe, new study findshttps://t.co/N0VQAQTLDP
The south pole warming: "This was not well predicted by climate models, meaning we are further along when it comes to the destabilisation of ice sheets and the commitment to rising sea levels than we expected to be at this point," Quote @MichaelEMannhttps://t.co/DM3yXSSgqr
The South Pole warmed three times the global rate in last 30 years, worrying researchers if climate change was playing a bigger role than expected in Antarctica https://t.co/Ij32ZeXc5Gpic.twitter.com/EdqPUfauPT
The Five Main Jet Stream Blocking Configurations and Consequences of Abrupt Climate Change /Jun 22, 2020
With slowing, wavier jet streams (less zonal; more meridional waves) the likelihood of atmospheric blocks is much greater. As I explained from a boat in the middle of a lake in my recent CTV News interview, blocking explains Ottawa’s present heat wave and the unbelievable, unprecedented Siberian heat wave. I explain five main blocking configurations:
summer block (basic ridge);
omega block;
anti-cyclonic wave breaking block;
cyclonic wave breaking block; and
Rex block.
I chat about how blocking changes with rapid climate change acceleration, and how consequences of this change are bad news for humanity and society.
Ref: Blocking and its Response to Climate Change. Link to download of PDF, here. Woollings, Barriopedro, Methven, et al. Published: 20 July 2018
‘Atmospheric blocking events represent some of the most high-impact weather patterns in the mid-latitudes, yet they have often been a cause for concern in future climate projections. There has been low confidence in predicted future changes in blocking, despite relatively good agreement between climate models on a decline in blocking. This is due to the lack of a comprehensive theory of blocking and a pervasive underestimation of blocking occurrence by models. This paper reviews the state of knowledge regarding blocking under climate change, with the aim of providing an overview for those working in related fields‘.
———- ———- Jet Stream Fracturing and Blocking With Abrupt Climate Change // Jun 19, 2020
As the Arctic warms at faster rates, decreasing the temperature gradient to the equator, jet streams slow and become wavier in the North-South direction (aka meridional), making the likelihood of getting stuck for weeks on end in persistent patterns called blocks greater.
Westerly winds must reroute around these blocks, either to the north of them or to the south of them, or get stalled out completely. As the jet streams weaken and get more fractured, the temperature contrast between land and ocean gain influence, as does the topography (orography) of the land below (mountains versus flat regions). Complexity abounds.
Ref: Extreme Weather, 12 June 2020: Jet stream: Is climate change causing more ‘blocking’ weather events?
‘Key to this unseasonable weather are persistent high-pressure “blocking” weather systems, which bring clear, dry conditions on the ground below for many days or weeks.
Blocking events bat away oncoming low-pressure systems that would bring the prospect of clouds and rain. They are particularly synonymous with heatwaves and drought in summer and bitterly cold conditions in winter‘.
———- ———-
How the Ribbon of Fast Moving High Altitude Air is Vital to Understanding Weather and Climate ///Jun 19, 2020
Understanding the jet streams is crucial for understanding weather patterns throughout the seasons. Understanding jet stream changes from year to year is crucial for understanding climate change. Essentially, the jet stream acts as a wall between cold, dry high latitude air at the poles and warm, humid lower latitude air. As the Arctic warms at ever faster rates, the jet streams slow and become much wavier in the North-South direction, making the likelihood of getting stuck for weeks on end in persistent patterns called blocks greater. However changes in the tropics are also very important to jet stream behaviour.
———- ———-
“The emperors are naked. Every single one. It turns out our whole society is just one big nudist party.”
Please consider donating to support my work. I put a lot of time and effort into researching, studying and producing my videos so that you can learn how quickly our world is changing. Donating does not need a PayPal account, but simply a credit card. Please click here.
———- ———-
The 6 warmest average January-May global temperatures have all occurred within the last 6 years…
The United States is in a covid cohort with five countries — Brazil, Russia, India, Mexico and Pakistan. It is about ten times richer than them. https://t.co/w19Jkq4VJe
— David Wallace-Wells (@dwallacewells) June 19, 2020
Former White House national security adviser John Bolton called President Donald Trump "naive and dangerous," in an interview that aired Sunday, adding that he hopes his former boss will be remembered as a one-term president. https://t.co/tt60E2kNVz
Jet Stream Change Driving and Responding to Abrupt Climate Change: Part 1 of Many // Jun 16, 2020
Throughout Earth history, physical changes in the jet stream (location, speed, waviness, width, etc.) have been vitally important for our weather and climate systems.
When a large quasi-stationary ridge forms west to east air flow and weather systems are blocked, causing extreme weather (heat waves; droughts under ridge; torrential rains; floods in adjacent troughs).
Climate models don’t agree on jet stream changes in the future as climate change rapidly accelerates.
In these videos, I discuss the overall picture of jet streams and then delve into the latest peer reviewed science on jet stream behavior.
Ref2: Jet Stream, A Journey Through our Changing Climate, Tim Woollings:
‘A fascinating introduction to the jet stream, providing insight into how it affects our weather, and how it relates to extreme weather events. Underlying science is built up as the story follows a weather balloon as it rides the jet stream around the world. An engaging blend of scientific writing and insightful historical and cultural contexts.
———- ———-
🚨 Last month was the *warmest* May on record for our planet. Striking anomalies across northern Siberia again.
Discovering New Things In Your Hometown, For the
First Time, Even Though You Have Lived There Twenty
———- ———-
Please consider donating to support my work. I put a lot of time and effort into researching, studying and producing my videos so that you can learn how quickly our world is changing. Donating does not need a PayPal account, but simply a credit card. Please click here.
———- ———-
This Vice article on degrowth is blowing up today. The Covid crisis has made unthinkable things thinkable… https://t.co/bRtGgjTCi6
Humans creating same conditions that led to Permian-Triassic extinction, also known as the Great Dying, took place 252 million years ago. It saw the loss of 90% of marine species, 70% land species, widespread loss of plant diversity extreme soil erosion. https://t.co/hXBZIw2tzspic.twitter.com/JnndnvMJQ0
Scientists have found that flushing a toilet can generate a cloud of aerosol droplets that rises nearly 3 feet and may linger in the air long enough to be inhaled by the next person to use the toilet https://t.co/GPyN35kVln
No Arctic Sea Ice in Aug and Sept for 2C Warming; July and Oct Sea Ice Vanishes at 2.5C: Part 1 of 2 // Jun 11, 2020
I continue studying the latest peer reviewed scientific studies on when we can expect the first Arctic Blue Ocean Event in September, and when adjacent months will become ice free. This video and the next are most important, must watch videos that converge to what I have been saying for many years. Here’s the bottom line; just the facts ma’am.
With 2C global mean temperature rise we expect August and September to be ice free.
With 2.5C we expect an ice free Arctic for July, August, September, and October.
———- ———- No Arctic Sea Ice in Aug and Sept for 2C Warming; July and Oct Sea Ice Vanishes at 2.5C: Part 2 of 2 // Jun 11, 2020
Following Part 1, we expect no Arctic Sea Ice in September when global average temperature reaches 1.7C above preindustrial.
August is ice free next at about the same time.
Next to fall is July, followed sequentially by October, June, November, May, December, and April.
Note July vanishing before October, then months fall out sequentially both sides (earlier month, than later month, etc.).
Finally, January sea ice, then February, and lastly March will vanish as we reach a year round ice free Arctic Ocean state.
———- ———- Effects of Aerosol Reductions on Arctic Temperature Rise and Rapid Arctic Sea Ice Loss: Part 1 of 2 // Jun 12, 2020
In previous videos I’ve discussed and estimated the global temperature rise from a reduction of worldwide aerosols due to global industrial slowdowns with our attempts to contain the Coronavirus.
Here, and in my next video I discuss huge temperature anomalies of 5 to 6 degrees C from January through May in Siberia, and
ongoing Arctic sea ice melt.
I ask whether there is a large influence from aerosol reductions in the Arctic, and examine two recent peer reviewed scientific papers that look at aerosol/sea ice connections.
———- ———- Effects of Aerosol Reductions on Arctic Temperature Rise and Rapid Arctic Sea Ice Loss: Part 2 of 2 // Jun 12, 2020
Here, and in my last video I ask whether there is a large aerosol reduction influence on rising Arctic temperatures, and thus on rapid Arctic sea ice melt losses.
Global aerosol reductions have occurred this year due to worldwide Coronavirus pandemic caused industrial shutdowns.
Ref: [1] ‘Globally, sulphur dioxide emissions, which lead to the formation of sulphate aerosols, peaked in the 1970s and have since declined by ∼15%. Correspondingly, there was a sharp increase in the burden of sulphate between 1950 and 1970; and since 1980, the burden has dropped. In contrast, black carbon emissions have increased throughout the twentieth century with a greater rate of increase between 1970 and 1990; the simulated global atmospheric burden of black carbon almost doubled during that time frame, but there is an indication of a decrease over the last decade‘.
[2] ‘Observations show that the Arctic sea ice cover has been shrinking at an unprecedented rate since the 1970s. Even though the accumulation of greenhouse gases in the atmosphere has been closely linked with the loss of Arctic sea ice, the role of atmospheric aerosols in past and future Arctic climate change remains elusive. Using a state-of-the-art fully coupled climate model, the authors assess the equilibrium responses of the Arctic sea ice to the different aerosol emission scenarios and investigate the pathways by which aerosols impose their influence in the Arctic.
‘These sensitivity experiments show that the impacts of aerosol perturbations on the pace of sea ice melt effectively modulate the ocean circulation and atmospheric feedbacks. Because of the contrasting evolutions of particulate pollution in the developed and developing countries since the 1970s, the opposite aerosol forcings from different midlatitude regions are nearly canceled out in the Arctic during the boreal summer, resulting in a muted aerosol effect on the recent sea ice changes.’
———- ———-
Earth just had its warmest May on record, according to four separate analyses, and there's an increasing chance 2020 may be the planet's warmest year. https://t.co/M1vV5rwC2apic.twitter.com/COiC1BetdB
— The Weather Channel (@weatherchannel) June 12, 2020
———- ———-
Please consider donating to support my work. I put a lot of time and effort into researching, studying and producing my videos so that you can learn how quickly our world is changing. Donating does not need a PayPal account, but simply a credit card. Please click here.
———- ———-
⚠️We need to watch ICU capacity dropping in these hotspot states. Positivity is rising along with cases (which means it’s outstripping testing volume change). But ICU is a late indicator epidemic will reach former NYC epidemic levels soon. #COVID19pic.twitter.com/DShG87RUrj
#Arctic sea ice extent is currently the 2nd lowest on record (JAXA data).
• about 310,000 km² less the 2010s mean • about 960,000 km² less the 2000s mean • about 1,470,000 km² less the 1990s mean • about 1,900,000 km² less the 1980s mean
⚠️AIRBORNE is the “dominant” route for the coronavirus transmission! New PNAS paper by a Nobel laureate’s group concludes this based on study of several studies and how transmission wasn’t truly slow until mask rules went into place. MASKS FOR ALL, please. https://t.co/nmergxbW20
After First Arctic BOE (Loss of All September Sea Ice) then What Happens Next to the Sea Ice? 1 of 2 // Jun 9, 2020
Many years ago I discussed my thoughts on how Arctic sea ice loss would play out.
After the first Blue Ocean Event (BOE: less than 1 million square kilometres of ice left) with open water in September, I argued that within a few years of that BOE open water would occur for Aug, Sept, and Oct;
within a few more years July and Nov would then become ice free, and
within a decade the entire Arctic Ocean would be ice free.
Will we reach an Ice Free Arctic Ocean State Year Round or will some ice persist year round? 2 of 2 // Jun 9, 2020
In this second part of a two part video series, I continue to delve into an important paper called “Changing state of Arctic sea ice across all seasons” to attempt to determine whether an initial Blue Ocean Event (BOE) will eventually lead to an ice free Arctic Ocean year round, or to an Arctic with no sea ice for about half the year.
The bottom line of this most recent research seems to indicate the latter case, at least for many years. However I still have the view that the cascading effects will lead to the ice free year round state within a decade or so of the initial BOE. No place on Earth is changing more than the Arctic.
———- ———-
Temperatures within the Arctic Circle have hit an astonishing 30C this afternoon. pic.twitter.com/8XbebEdRsn
Please consider donating to support my work. I put a lot of time and effort into researching, studying and producing my videos so that you can learn how quickly our world is changing. Donating does not need a PayPal account, but simply a credit card. Please click here.
———- ———-
Amazon Rainforest whiplashing (flickering) between drought and flood: 2005: 100 year drought 2009: massive floods 2010: 100 year drought 2012: massive floods 2014: massive floods 2015-16: 100 year drought Many systems flicker before tipping. 1/2https://t.co/LJNz6y8c26
This drone footage shows a long line of voters waiting to cast ballots in Atlanta on Tuesday. Georgia election officials, poll workers and voters have reported major trouble with voting in Atlanta and elsewhere.
‘Sea ice plays a critical role in the Earth’s climate by regulating the exchanges of heat, momentum and moisture between the atmosphere and the polar oceans, and by redistributing salt within the ocean. Sea ice primarily exists in the polar regions, and throughout the observational record, at least 16 million km2 or about 5%, of the world’s oceans have been covered by sea ice at any one time. Because of its high reflectivity, sea ice reflects the majority of the sun’s radiation reaching the surface back to space, which efficiently cools the polar regions of our planet.
‘As sea ice melts at its surface, its surface albedo is lowered, which in turn increases the amount of the sun’s energy absorbed by the ice surface and further enhances ice melt. When the ice completely melts, this solar radiation is absorbed by the darker ocean surface, generating a positive feedback that amplifies Arctic air temperatures in autumn and winter as the ocean returns the heat gained in summer back to the atmosphere‘.
Jet Stream Shift 17 degrees Southward to Greenland
Summary
Well known and respected creator of entertaining and comprehensible videos of sometimes daunting subjects, especially in climate system science, meteorology, oceanography and Earth Sciences at YouTube.
Frequently called upon for commentary by fellow educators, activists, and public. Physicist, Engineer, and part-time professor at the University of Ottawa. His primary interest is joining-the-dots on Abrupt Climate System Change to determine where we are heading, and how fast, and what it all means for us and our amazing planet.