Updating the Climate Science: Truth and Consequences: 1 of 3 // Jul 17, 2020
Dr James E. Hansen is one of my climate heroes. He tried to tell the world about the grave threat of climate change by testifying to the US Congress in 1988 but nobody wanted to listen. Ten years ago he wrote the totally awesome book “Storms of my Grandchildren”.
He and his team diligently update numerous graphs on global energy, global temperature, solar activity, greenhouse gas levels and rates of change, ENSO cycles, global precipitation and drought, wind, hurricanes, tornadoes, wildfires, sea level, Greenland and Antarctica ice sheet loss, butterflies, forcings, aerosols, and paleoclimate. Have I missed anything:)?

Ref 2: ‘Updating the Climate Science, What Path is the Real World Following?‘
Makiko Sato & James Hansen.

Fossil Fuel CO2 Emissions and Energy Use: Energy Consumption (last modified 2020/06/25).

———- ———-
Updating the Climate Science: Truth and Consequences: 2 of 3 // Jul 17, 2020
I continue chatting on James Hansen climate graph updates and key findings.
- Global emissions continue rising,
- exceeding 10 PgC/yr (Gt/yr), with the airborne fraction from 45 to 64%.
- Atmospheric CO2 growth is about 2.5 ppm/yr (5-year mean) spiking over 3 ppm/yr some years.
- Global surface temperature relative to 1880-1920 mean is 1.3C (add 0.3 for 1750 baseline).
- Land surface temperature rise is about double that of sea surface temperature rise.
- Northern Hemisphere warming anomaly is greatest in autumn, then winter, then spring and least in summer.
- Siberia is gonzo.
- Solar irradiance is at a minimum in sunspot cycle.

———- ———
Updating the Climate Science: Truth and Consequences: 3 of 3 // Jul 17, 2020
Global temperature in 2020 is exceeding the record set in powerful El Niño event 2015-2016, in spite of it not being another El Niño year.
- Global precipitation mayhem results in torrential rains with huge floods in some regions and extreme droughts in other regions (both bad for crops).
- Number of powerful Category 3 to 5 Atlantic hurricanes is trending upwards, as is number of top end tornadoes.
- Wildfire average is increasing, correlated with temperature anomalies.
- Sea level rise is accelerating, with Greenland and Antarctica ice mass loss rates doubling every 10 years.
- Arctic sea ice is getting crushed like a bug.

———- ———-
———- ———-
Please consider donating to support my work. I put a lot of time and effort into researching, studying and producing my videos so that you can learn how quickly our world is changing. Donating does not need a PayPal account, but simply a credit card. Please click here.
———- ———-
https://twitter.com/chriscartw83/status/1284219081432997890?s=20
———- ———-

Extra share: ‘Politics & Policy, How 2020 and the coronavirus are accelerating the future‘, Jul 14, 2020.
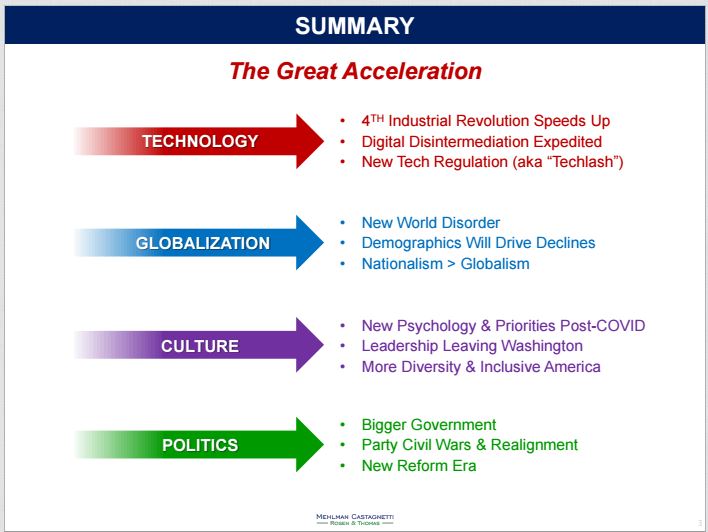
Or ‘The Great Acceleration‘.


What’s the evidence for an increase in the number of “top end” tornadoes? Before that, what is a “top end” tornado?
LikeLike