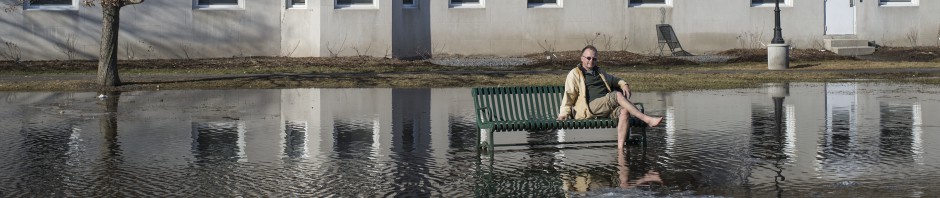
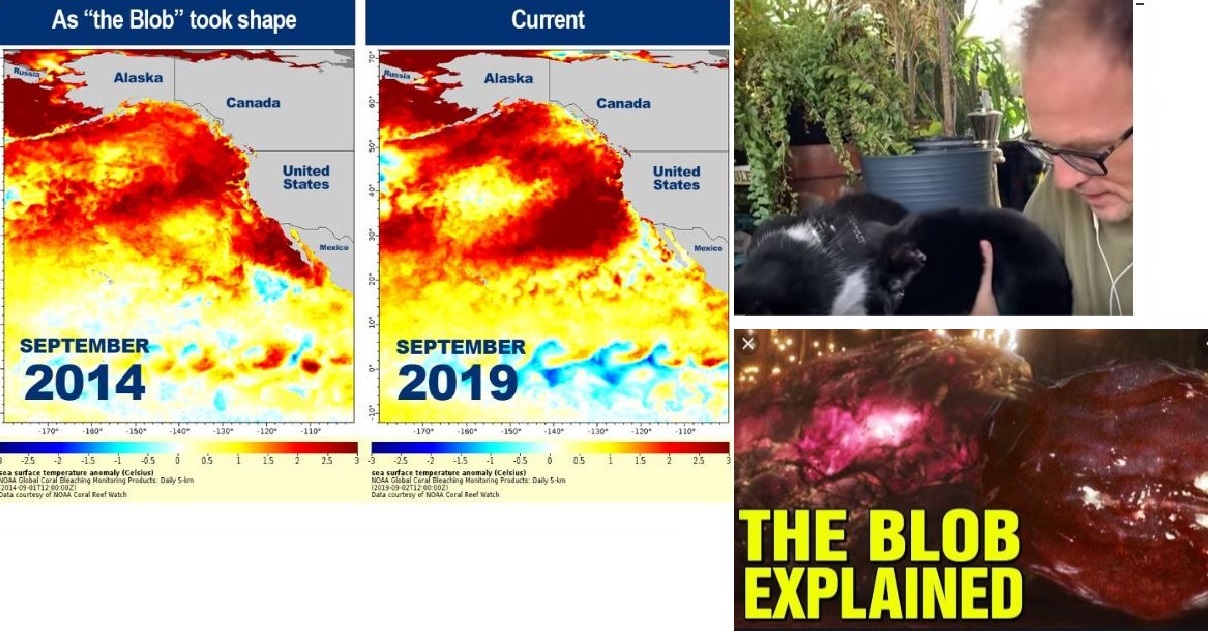
Return of the BLOB; aka Marine Heat Wave // Sep 25, 2019
In 2014 a phenomena appeared on which there is no history. The ocean temperature off the west coast of North America rose and destroyed marine diversity and wreaked havoc on weather patterns around the globe. Known as the “BLOB”, this voracious spot raised water temperatures in the North Pacific between 4 and 5 degrees Celsius (7-8 F), killing off humpback whales, Pacific cod, and huge numbers of birds, among other creatures.
Is the BLOB, otherwise known as a Marine Heat Wave (MHW) back to torture us? Water temperature is thus far up 2.8 degrees C.
———- ———-
Marine Heat Waves Resulting in Severe Consequences: BLOB 2.0 // Sep 26, 2019
I continue chatting on the new “BLOB”, this voracious spot of very high water temperatures in the North Pacific Ocean, otherwise known as a Marine Heat Wave (MHW). As abrupt climate change accelerates, the heating is highly non uniform across the planet. Most people know that Arctic Warming is 3x to 5x faster than the global average, but not that:
land is warming 2x faster than oceans
mountain regions 2x to 3x faster
western ocean boundary currents 2x to 3x faster than the overall ocean.
Please consider donating to support my work. I put a lot of time and effort into researching, studying and producing my videos so that you can learn how quickly our world is changing. Donating does not need a PayPal account, but simply a credit card. Please click here.
———- ———-
After discussing with Greta here in Potsdam and in Stockholm, I can vouch that she acts out of her own authentic motivation, and she knows the science. I wish more politicians would get this well-informed about climate science! Why is that not the case? https://t.co/PRIWTfwmZJ
Paul just asked that this be published, to this site, dk:
Greta Thunberg’s full speech to world leaders at UN Climate Action Summit // Sep 23, 2019
‘Swedish climate activist Greta Thunberg chastised world leaders Monday, Sep. 23, for failing younger generations by not taking sufficient steps to stop climate change. “You have stolen my childhood and my dreams with your empty words,” Thunberg said at the United Nations Climate Action Summit in New York. “You’re failing us, but young people are starting to understand your betrayal. The eyes of all future generations are upon you. And if you choose to fail us, I say we will never forgive you,” she added.
Thunberg traveled to the U.S. by sailboat last month so she could appear at the summit. She and other youth activists led international climate strikes on Friday in an attempt to garner awareness ahead of the UN’s meeting of political and business leaders.’
Ref2: ‘Climate activist Greta Thunberg, 16, addressed the U.N.’s Climate Action Summit in New York City on Monday. Here’s the full transcript of Thunberg’s speech, beginning with her response to a question about the message she has for world leaders.
“My message is that we’ll be watching you.
“This is all wrong. I shouldn’t be up here. I should be back in school on the other side of the ocean. Yet you all come to us young people for hope. How dare you!
“You have stolen my dreams and my childhood with your empty words. And yet I’m one of the lucky ones. People are suffering. People are dying. Entire ecosystems are collapsing. We are in the beginning of a mass extinction, and all you can talk about is money and fairy tales of eternal economic growth. How dare you!
“For more than 30 years, the science has been crystal clear. How dare you continue to look away and come here saying that you’re doing enough, when the politics and solutions needed are still nowhere in sight.
“You say you hear us and that you understand the urgency. But no matter how sad and angry I am, I do not want to believe that. Because if you really understood the situation and still kept on failing to act, then you would be evil. And that I refuse to believe.
“The popular idea of cutting our emissions in half in 10 years only gives us a 50% chance of staying below 1.5 degrees [Celsius], and the risk of setting off irreversible chain reactions beyond human control.
“Fifty percent may be acceptable to you. But those numbers do not include tipping points, most feedback loops, additional warming hidden by toxic air pollution or the aspects of equity and climate justice. They also rely on my generation sucking hundreds of billions of tons of your CO2 out of the air with technologies that barely exist.
“So a 50% risk is simply not acceptable to us — we who have to live with the consequences.
“To have a 67% chance of staying below a 1.5 degrees global temperature rise – the best odds given by the [Intergovernmental Panel on Climate Change] – the world had 420 gigatons of CO2 left to emit back on Jan. 1st, 2018. Today that figure is already down to less than 350 gigatons.
“How dare you pretend that this can be solved with just ‘business as usual’ and some technical solutions? With today’s emissions levels, that remaining CO2 budget will be entirely gone within less than 8 1/2 years.
“There will not be any solutions or plans presented in line with these figures here today, because these numbers are too uncomfortable. And you are still not mature enough to tell it like it is.
“You are failing us. But the young people are starting to understand your betrayal. The eyes of all future generations are upon you. And if you choose to fail us, I say: We will never forgive you.
“We will not let you get away with this. Right here, right now is where we draw the line. The world is waking up. And change is coming, whether you like it or not.
“Thank you.”
———- ———-
Signs and impacts of climate change speeding up, latest science says: -> Sea-level rise accelerating from 3.2mm per year since 1993 to 5mm per year ->5-year period from 2014 to 2019 warmest on record ->Temperatures up by 1.1°C since 1850, 0.2°C just between 2011 and 2015 pic.twitter.com/2O0OV0zAER
Please consider donating to support my work. I put a lot of time and effort into researching, studying and producing my videos so that you can learn how quickly our world is changing. Donating does not need a PayPal account, but simply a credit card. Please click here.
———- ———-
Here is the first of three new videos dealing with much more southern weather and oceanography, posted today and yesterday. Paul also added one more video dealing with the North Pole and Greenland from our recent post, here. This is from three days ago.
Record Setting Sudden Stratospheric Warming (SSW) Over Antarctica: Causes and Consequences //
I shift gears from the Arctic to chat about the Southern Hemisphere and Antarctica. Since the last week of August, the stratospheric polar vortex first became elongated and then completely destabilized, with some regions warming up abruptly from about -70C to an incredible +13C, causing the high altitude vortex to morph into two and then even three vortices.
My understanding is that rapid loss of Antarctic sea ice in some regions and gain in others caused an asymmetry of sea ice around the continent, thus causing asymmetry and breakdown of the vortex.
———- ———-
“By 2100, average temperatures could rise 7 degrees Celsius above pre-industrial levels if carbon emissions continue unabated, two separate models set to replace those used in current UN projections, from two different leading research centers showed.” https://t.co/6KKFekVsUQ
Please consider donating to support my work. I put a lot of time and effort into researching, studying and producing my videos so that you can learn how quickly our world is changing. Donating does not need a PayPal account, but simply a credit card. Please click here.
———- ———-
What’s up (down) with Arctic Sea-Ice: Extent, Thickness, Volume Dynamics and Thermodynamics // Sep 12, 2019
In September, 2012 Arctic sea ice extent (regions with at least 15% sea ice concentration) set a record low extent, far below any previous year and subsequent year, until now.
This year, up until about mid-August, sea ice extent closely tracked 2012, in fact was even lower than 2012 for long periods of time. Then, quite unexpectedly, 2019 melt significantly flattened out, stalling to be far behind 2012.
In this first of a series of videos, I discuss possible reasons for this stalling, in light of the fact that sea-ice volume continued to track closely to that in 2012, with no sign of stalling.
———- ———-
New Ice Behavior Regime for Arctic Sea Ice Melt // Sep 132, 2019
I continue discussing details of Arctic sea ice melt, including the puzzling stalling of the extent drop in mid-August; yet continuation of volume loss to match 2012 (year that set records for both lowest volume and lowest extent).
Physical properties of the sea ice remaining are different since most of the stronger, purer (less salt content), thicker, older multi-year ice has melted out, or been exported and melted, leaving behind only weaker, saltier, thinner, younger first year and second year ice. We are in a new ice behavior regime, with different melt and freeze dynamics.
———- ———-
Is Climate System Internal Variability Significantly Messing with Arctic Sea Ice Demise Predictions? // Sep 13, 2019
Continuing my Arctic sea ice loss videos, I discuss a paper on sea ice thickness variability arguing that internal variability of the climate system is very large, and thinner ice is even more sensitive to internal variability.
It suggests that we cannot predict complete loss of Arctic sea ice within a time window of less than 20 years; and that the difference in emissions pathways between RCP4.5 and RCP8.5 adds 5 more years to uncertainty. I am extremely skeptical of this result. To me, large variability means when a large negative swing occurs the sea ice will unexpectedly and rapidly vanish.
Ref: ‘How predictable is the first ice-free Arctic summer?’ 25 August 2016 17:44, Guest post by Dr. Alexandria Jahn.
———- ———-
Variability of Arctic Sea Ice Thickness in Six Different Arctic Basins // Sep 14, 2019
Continuing my Arctic sea ice loss videos, I examine a paper on sea ice thickness variability that uses the PIOMAS model and a Community Earth System Model. Dividing the Arctic Ocean up into 6 different basins:
Barents-Kara Seas,
Laptev Sea,
East Siberian Sea,
Beaufort-Chukchi Seas,
Greenland Sea, and the
Central Arctic Basin (CAB).
It examines each basins sea ice thickness history and projections, and timing as to when basin thickness average falls below 0.5 meters. Greenland Sea lasts longest (cushioned by cold glacier meltwater); the CAB lasts next longest.
———- ———-
Global atmospheric temperature change (1979-2018).
The lower atmosphere is warming while the upper atmosphere is cooling – a clear fingerprint of the enhanced greenhouse effect from human emissions of carbon dioxide. #showyourstripespic.twitter.com/0VdHs00Fq0
Please consider donating to support my work. I put a lot of time and effort into researching, studying and producing my videos so that you can learn how quickly our world is changing. Donating does not need a PayPal account, but simply a credit card. Please click here.
———- ———-
A beautiful, informative article discussing how climate has changed over the last ~120 years.
The rate of #Arctic sea ice decline has significantly slowed compared to 2012. It is very unlikely this year will set a new record minimum extent in September. pic.twitter.com/VlGO4GKt6H
The growing threat of the gas dubbed “the electrical industry’s dirty little secret…”
THREAD
Emissions of Sulphur Hexafluoride (SF6) have risen dramatically in recent years partly due to renewable energy @bbcnews EXCLUSIVEhttps://t.co/cQZx8VDobI
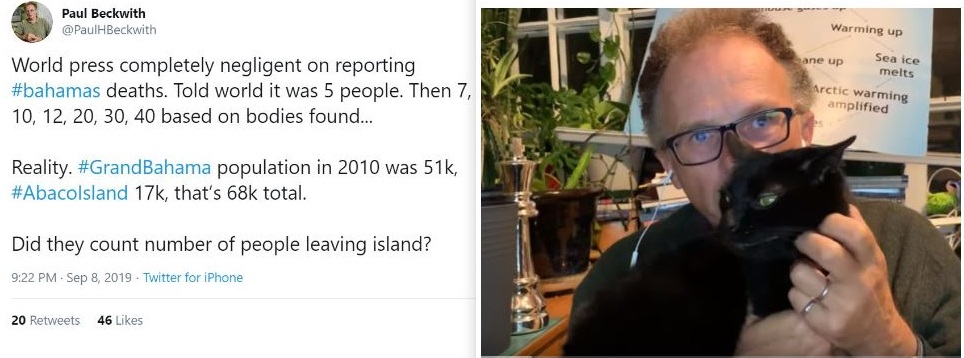
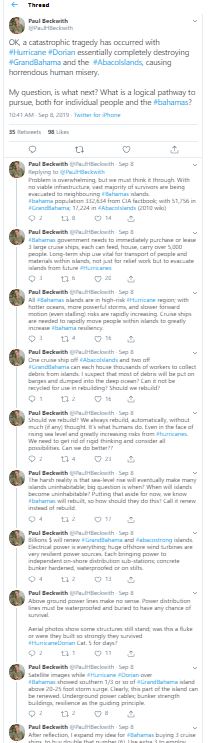
Bahama Death Toll of 40,000 from Hurricane Dorian: My Estimate // Sep 9, 2019
Just after Category 5 Hurricane Dorian stalled over the Grand Bahamas and Abaco Islands for 1.5 days, with
185 mph sustained winds (225 mph gusts) and a
storm surge covering 2/3 of the islands,
with up to 25 foot deep seawater,
the world media reported an absurd death toll of exactly 5 people.
Over the next 10 days their insane number climbed to 7, 10, 20, …, 45. What really happened?
I estimate a death toll of up to 40,000 people; over 10% of the countries population. Most of these people were likely washed out to sea by the massive storm surge, never to be seen again.
———- ———-
How Bahamas (and ALL Caribbean) can Increase Resiliency to Face Onslaught of MASSIVE Hurricanes // Sep 9, 2019
Clearly, the northernmost Bahama islands have been essentially destroyed with tremendous loss of life; last video I estimated 40,000 dead; most people washed out to sea to never be seen again. The world faces many extremely difficult decisions on what to do moving forward, including should we even rebuild, to be destroyed again?
Given that we do rebuild, I chat about how it should be done in the most resilient way possible, and suggest that the Caribbean Island’s own their own cruise ships to greatly increase resiliency in the face of massive hot-water charged superstorms.
———- ———-
Please consider donating to support my work. I put a lot of time and effort into researching, studying and producing my videos so that you can learn how quickly our world is changing. Donating does not need a PayPal account, but simply a credit card. Please click here.
———- ———-
"Just two vendors—ES&S & Dominion Voting—account for 80% of US election equipment. Thus, corrupt insiders or foreign hackers could wreak havoc on elections throughout the US by infiltrating either of these vendors." By @jennycohn1 Thread. 1/ https://t.co/eYU69P4AuT
Here is the full story we put together after getting off the ferry this morning. Hurricane evacuees kicked off the boat. Crew on the boat blamed US Customs and Border Protection, CBP now blames the ferry company @Balearia . pic.twitter.com/QLRcxbALdk
Hurricane Danger Increasing from Climate Change: chat on the SCIENCE // Sep 3, 2019
I delve deeply into recent, cutting edge science on how climate change is making hurricanes more dangerous. Sea Surface Temperatures (SSTs) above 26.5 C fuel cyclones, making them more intense.
Global satellite coverage available since 1985 shows a consistent average of 80 tropical cyclones per year,
varying from 65 to 90, with no discernible trend.
However, since 1975 there has been a substantial increase in the proportion of Cat. 4 -5 hurricanes of 25-30% per degree C of global warming (and a similar decrease in Cat. 1 -2 hurricanes.
Rapid intensification of hurricanes has increased 4.4 mph per decade.
———- ———-
Unprecedented Behaviour: Category 5 Dorian Gets Stuck on Grand Bahama Island // Sep 3, 2019
What causes a Category 5 Hurricane (Cat. 6 if it existed) to park itself over Grand Bahama Island, and stay stationary over 1.5 days while churning away, grinding the island to a pulp, and submerging lots of the island under 24 feet of seawater?
I show you on Earth NullSchool how Dorian behaved, and then I delve into the science on how climate change is making hurricanes much more dangerous. Imagine what would happen if Dorian had parked itself off Miami instead; the damage to Florida’s east coast could have run into trillions of dollars. We must think about the unthinkable, with abrupt climate change.
———- ———-
Hurricane Dorian Essentially Wipes Grand Bahama Island from the Map // Sep 3, 2019
It is heart-wrenching witnessing utter devastation that Hurricane Dorian unleashed on the Bahamas. This powerful Category 5
(sustained winds over 180 mph (300 km/hr),
peak winds 225 mph (360 km/hr),
storm surge 24 feet)
razed and submerged lots of Bahama’s northern islands,
unprecedentedly parking over Grand Bahama for 36 hours.
Imagine being hit by winds equal to a tornadoes EF3-EF4 not for a minute or so, but continuously for 1.5 days, while inundated with 24 foot ocean surge, and torrential rainfall. If this had occurred 50 miles to the west, it could have caused trillions of dollars of damage to Florida’s east coast.
‘Major hurricanes are by far the world’s costliest natural weather disasters, in some cases causing well over $100 billion in damage. There’s now evidence that the unnatural effects of human-caused global warming are already making hurricanes stronger and more destructive. The latest research shows the trend is likely to continue as long as the climate continues to warm.’
———- ———-
First person account of Dorian who was lucky to escape with his life. HurricaneMan:
Please consider donating to support my work. I put a lot of time and effort into researching, studying and producing my videos so that you can learn how quickly our world is changing. Donating does not need a PayPal account, but simply a credit card. Please click here.
———- ———-
Island of 50,000 People in the #Bahamas Is 70% Under Water
Yep, I’m alive. Made it to Nassau. #Hurricane#DORIAN: By far the most intense cyclone I’ve witnessed in 28 years of chasing. Thought I was playing it safe by riding it out in a solid-concrete school on a hill in Marsh Harbour. Thought wrong.
Since records began in 1851, #Dorian is the slowest moving major hurricane (something that scientists have linked to a warming climate). This is what happens when a storm just sits like a blender over the Bahamas. pic.twitter.com/5qxHKfh7N7
Amazon Rainforest as a Significant but Highly Vulnerable Global Climate Tipping Element // Aug 27, 2019
The Amazon Rainforest is one of the very significant yet vulnerable tipping elements in the overall climate system. Willful human destruction of the rainforest by slash-and-burn techniques (trees are toppled by chainsaw or tractors with chains, allowed to dry out, and are then torched) is behind 99% of the present fires, according to some accounts. In this first of a series of 5 videos, I wade through the science and attempt to determine the most accurate numbers on the Amazon Rainforest impact as a carbon sink and oxygen producer, in the overall global context.
———- ———-
Vital Significance of Amazon Rainforest as Carbon Sink // Aug 27, 2019
How significant, on a global scale, is the Amazon Rainforest? Best I can tell, correct annual numbers are: Tropical rainforests account for 34% of land-based global photosynthesis; Amazon Rainforest is almost half that, namely 16%. Total oxygen produced by land-based photosynthesis is 330 Pg, thus Amazon is 54 Pg. Ocean phytoplankton oxygen production is 240 Pg. Total global photosynthesis is 330 + 240 = 570 Pg of oxygen (58% land, 42% ocean). Amazon produces 54/570=9.5% of total global oxygen; with carbon sink being 9.5% of global plant total sink.
———- ———-
Amazon Rainforest: Crunching the Numbers // Aug 27, 2019
As far as I can tell in my analysis, the most accurate numbers on carbon sink and oxygen production sizes for the Amazon Rainforest in a global photosynthesis context are in a blog by ecologist Yadvinder Malhi, which I discuss in detail within this series of 5 videos (this one is 3/5). If the entire Amazon Rainforest was to collapse (burn) then about 90 Pg of carbon would be released to the atmosphere (adding about 40 ppm, an increase of almost 10% of our present 415 ppm), using up 240 Pg of oxygen (a very small 0.02% of the oxygen level in the atmosphere).
———- ———-
We Need to Plant Many New Amazon Equivalents, Not Destroy Our Existing One // Aug 27, 2019
If the entire Amazon burned down, a release of 90 Pg of carbon to the atmosphere, equivalent to a 40 ppm rise in atmospheric CO2, was mentioned in the previous video description based on Yadvinder Malhi blog. By the same token, if people on Earth got their act together and planted a new Amazon (about 390 billion trees, estimated from Amazon Wikipedia) this would drawdown about 40 ppm (90 Pg) or 10% of atmospheric concentration. At present, atmospheric CO2 rises 2-3 ppm/year, so 40 ppm is only between13-20 years worth of global emissions.
———- ———-
Playing with Amazon Fire will get us all Burned // Aug 27, 2019
According to the Wiki on Amazon Rainforest: “In 2018 about 17% of the Amazon Rainforest was already destroyed. Research suggests that upon reaching about 20-25% (hence 3-8% more), the tipping point to flip it into non-forest ecosystems – degraded savannah – (in eastern, southern and central Amazonia) will be reached.” Given 3 recent century scale droughts in the Amazon Rainforest in 2005, 2010, and 2015-2016, and slash-and-burn human practices accelerating again, we are quite literally playing with fire in a game we cannot win.
———- ———-
This story is a real bombshell. Reporter Ryan Grim reveals that one of the biggest culprits of Amazon destruction is a US company, Blackstone, whose CEO is close friends with Trump and bankrolls the US Senate leader Republican Mitch McConnell. https://t.co/Kphs5dPA70
Please consider donating to support my work. I put a lot of time and effort into researching, studying and producing my videos so that you can learn how quickly our world is changing. Donating does not need a PayPal account, but simply a credit card. Please click here.
———- ———-
People tell me ditching school is bad, but I must say, "nurdles" are way worse.https://t.co/cr5gcB7CH4
Browning of the Earth: Land Plant Growth Decline Since 1998: Part 1 of 2 // Aug 23, 2019
Earth stopped getting greener 20 years ago. A new research study used satellite images to determine that plant growth on land increased in the 1980s and 1990s, but reached a turning point in 1998, and has since been decreasing.
The decrease is mostly attributed to decreasing moisture in the air, as measured by a Vapour Pressure Deficit (VPD) parameter; which is the difference between the actual amount of moisture in the air versus the maximum amount of moisture possible in the air (saturation) at the given temperature.
‘The world is gradually becoming less green, scientists have found. Plant growth is declining all over the planet, and new research links the phenomenon to decreasing moisture in the air—a consequence of climate change. * The study published yesterday in Science Advances points to satellite observations that revealed expanding vegetation worldwide during much of the 1980s and 1990s. But then, about 20 years ago, the trend stopped. *
‘Since then, more than half of the world’s vegetated landscapes have been experiencing a “browning” trend, or decrease in plant growth, according to the authors. * Climate records suggest the declines are associated with a metric known as vapor pressure deficit—that’s the difference between the amount of moisture the air actually holds versus the maximum amount of moisture it could be holding. A high deficit is sometimes referred to as an atmospheric drought‘.
Ref 3: ‘Increased atmospheric vapor pressure deficit reduces global vegetation growth‘, Science Advances 14 Aug 2019:
‘Atmospheric vapor pressure deficit is a critical variable in determining plant photosynthesis. Synthesis of four global climate datasets reveals a sharp increase of VPD after the late 1990s. In response, the vegetation greening trend indicated by a satellite-derived vegetation index, which was evident before the late 1990s, was subsequently stalled or reversed… Six Earth system models have consistently projected continuous increases of VPD throughout the current century‘.
———- ———-
Atmospheric Drying Reducing Terrestrial Vegetation Growth Since 1998: Part 2 of 2 // Aug 23, 2019
It is well known that global vegetation decline is worsening from:
land-use forest clearing,
wildfires,
desertification,
drought,
soil degradation …
But some regions like the Arctic are greening. We also know that the maximum amount of moisture air can hold at saturation goes up by 7% per degree C temperature rise.
This temperature rise increases atmospheric water vapour content via ocean, lakes, rivers, and soil water evaporation and evapotranspiration from plants.
If this increase is under 7%, a Vapour Pressure Deficit occurs, plant stomata shrink, and vegetation growth slows reducing global primary productivity.
—–
Ref: ‘Global water cycle amplifying at less than the Clausius-Clapeyron rate‘, Nature-Published: 09 December 2016, ‘Understanding and quantifying observed global water cycle change is key to predicting future climate. The Clausius-Clapeyron relationship predicts an increase in the water holding capacity of air (the saturation water vapor pressure) of approximately 7% per degree Celsius rise in temperature2. It has been suggested that this would lead to a strengthening of the global evaporation (E) minus precipitation (P) pattern with global surface warming…‘
———- ———-
Another reminder of the human footprint… (red = flights, blue = ships, green = roads, yellow = lights)
Please consider donating to support my work. I put a lot of time and effort into researching, studying and producing my videos so that you can learn how quickly our world is changing. Donating does not need a PayPal account, but simply a credit card. Please click here.
———- ———-
#28 The climate plan that @BernieSanders just released is remarkable–it shows what simply must be done to meet the challenge physics has laid out. (And it would save a fortune by helping to keep heating under some kind of control) #demunitytwitterprojecthttps://t.co/q6Ojul5Xq5
Any thoughts on slowdown. Perhaps negative feedbacks are kicking in: – the thinner and more broken up the ice gets, the more it spreads, cooling air and surface water – more clouds over open water raise albedo, causing cooling – ice confined to center results in much less export https://t.co/Gi2j5daXLp
An Arctic Blue-Ocean Event (BOE) that is very likely by 2022 will cause very large Arctic warming. With no sea-ice left to melt, we lose our Arctic “refrigerator” and all that previous “latent heat” will now be “sensible heat” jacking up temperatures. This will further expose Greenland to accelerated, catastrophic ice loss with rapid sea-level rise and abrupt increases in frequency, severity, duration of extreme weather events globally.
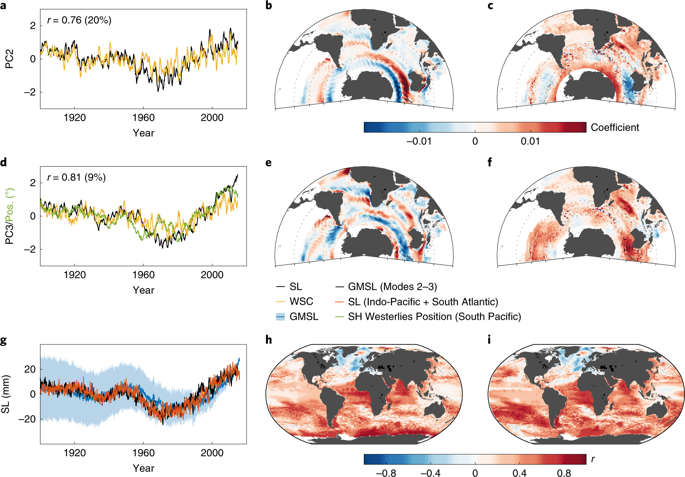
‘Previous studies reconstructed twentieth-century global mean sea level (GMSL) from sparse tide-gauge records to understand whether the recent high rates obtained from satellite altimetry are part of a longer-term acceleration. However, these analyses used techniques that can only accurately capture either the trend or the variability in GMSL, but not both. Here we present an improved hybrid sea-level reconstruction during 1900–2015 that combines previous techniques at time scales where they perform best.
‘We find a persistent acceleration in GMSL since the 1960s and demonstrate that this is largely (~76%) associated with sea-level changes in the Indo-Pacific and South Atlantic. We show that the initiation of the acceleration in the 1960s is tightly linked to an intensification and a basin-scale equatorward shift of Southern Hemispheric westerlies, leading to increased ocean heat uptake, and hence greater rates of GMSL rise, through changes in the circulation of the Southern Ocean.’
———-
‘During the past week, temperatures at the highest reaches of the Greenland ice sheet rose above freezing, melting snow at the Summit Station (10,550 feet above sea level) for the first time since July 2012 and perhaps only the third time in the last seven centuries.
Across lower elevations around the margins of the ice sheet, bare glacial ice melted at an unprecedented rate, losing 12.5 billion tons of water on Thursday alone, with daily losses likely exceeding any point in at least the past 70 years.’
———- ———–
Charleston Bridge Chat on Chinese Hoaxes, Summit of Minds, and Santiago, Chile Climate Conference // Aug 15, 2019
Hello, how are y’all doing? We all need a vacation from climate change from time to time, and this week it has been my turn. I’ve been in Charleston, South Carolina with my family for about a week, visiting the sights and learning the history. People here are extremely nice and friendly, but when asked what I do for a living I replied that people give me money for studying and teaching them all about Chinese Hoaxes. Some folk look surprised, or puzzled, or give me blank stares, while others start to laugh. I immediately know that the latter are the ones who get it and are on my side:)
———- ———-
Paul’s Vacation Boat Trip 7 Miles Off Charleston, South Carolina: Quirky Video // Aug 15, 2019
Vacation. Glorious Vacation. Pop a Gravol or Ginger Pill and come onboard a boat journey with me on my Charleston road-trip vacation. A quarky video, for sure, I must warn you, with somewhat dubious quality due to wave jumping instability bouncing my iPhone camera. But if you like the ocean, and motion, this is a must see.
You see an ongoing dredging operation 7 miles out from Charleston to deepen channels to allow huge new supertankers and cargo ships access to the port,
a tugboat heading straight for us to get us to clear off,
an enormous container ship passing us generating a bone jarring mini-tsunami wake for us, and much more.
Grab some popcorn and settle in for a whale of a ride:) By the way, when is Tesla going to come out with an electric speedboat??
———- ———-
Third day in a row with the #Greenland ice sheet losing more than 10 billion tons. Repeat: This is the surface mass balance (snowfall minus runoff) and does not include calving icebergs and melting when glaciers meet relatively warm seawater. pic.twitter.com/vscZD5pZzg
Please consider donating to support my work. I put a lot of time and effort into researching, studying and producing my videos so that you can learn how quickly our world is changing. Donating does not need a PayPal account, but simply a credit card. Please click here.
———- ———-
Shipping is largely invisible, yet is an enormous source of CO2 and SOX pollution that enables rampant consumption. By shifting to local consumption, we get a much more sustainable world economic system. pic.twitter.com/veF3ioTsKg
1 speak poorly about others 2 have problems for every solution 3 enjoy complaining 4 always feel entitled 5 blame others for losing 6 take more than give 7 make you feel bad about yourself 8 cheat or lie 9 bully or troll 10 nitpick as a hobby
Jet Stream Shift 17 degrees Southward to Greenland
Summary
Well known and respected creator of entertaining and comprehensible videos of sometimes daunting subjects, especially in climate system science, meteorology, oceanography and Earth Sciences at YouTube.
Frequently called upon for commentary by fellow educators, activists, and public. Physicist, Engineer, and part-time professor at the University of Ottawa. His primary interest is joining-the-dots on Abrupt Climate System Change to determine where we are heading, and how fast, and what it all means for us and our amazing planet.