Grave Early Warning Observational Signs for Pending Near-Term AMOC Ocean Circulation System Collapse

Grave Early Warning Observational Signs for Pending Near-Term AMOC Ocean Circulation System Collapse

I delve into the details of a new paper on the risks of a pending AMOC (Atlantic Meridional Overturning Circulation) tipping from the present strong mode to a new weak mode. If the present AMOC shuts down and a new, weaker state is established there will be enormous consequences to society and Earth’s ecosystems.

I use Earth NullSchool and Climate Reanalyzer to examine to present state of the surface ocean currents and Sea Surface Temperature (SSTs) and examine recent scientific evidence that the AMOC is at its weakest state in 1600 years, and that there is observational evidence that the slowing in the last decade has accelerated, and we may in fact be on the brink of a system shutdown and reconfiguration.

A house on stilts in Nags Head, North Carolina surrounded by high tide surf. Image Credit: John Greim/LightRocket via Getty Images

When a highly complex nonlinear system approaches a tipping point threshold, the system variability often increases and there is a “critical slowing down” in the frequency components of the system. Essentially, the system loses elasticity and resiliency and becomes rigid and brittle, and then shatters or breaks and enters a new, often irreversible state.

We are seeing this increased variability and critical slowing down in both the sea surface temperature and sea surface salinity in the critical locations that drive the thermohaline circulation system. It seems that a tipping point to a new ocean circulation system, with slower ocean currents and lower latitude loops may occur in the near term future.
———– ———–

Please donate to here, to support my research and videos as I connect the dots on abrupt climate system change.
———- ———-

Ref 1: A major Atlantic current is at a critical transition point, by Kara Norton. Feb 17, 2022

Around 15,000 years ago, the Earth began to transition from a state of heavy glacial coverage to a period of warming. As temperatures rose, large ice sheets that once blanketed much of North America and Europe thawed, and the oceans began to rise.

But after 2,000 years of warming, the Earth abruptly cooled to near-glacial conditions. And it stayed that way for more than a thousand years.

Scientists have long debated how this abrupt climatic event, which they call the Younger Dryas, occurred. This question has become an urgent one as some researchers think an abrupt climatic event could happen again and disrupt the Gulf Stream, the forceful ocean current that transports warm water from the Gulf of Mexico up North America’s Northeast coast.

An analysis published in the journal Nature Climate Change in August found that the larger system that the Gulf Stream is part of, called the Atlantic Meridional Overturning Circulation (AMOC), is approaching a tipping point.

Over the last century, this ocean circulation system has “moved closer to a critical threshold, where it may abruptly shift from the current, strong circulation mode to a much weaker one,” says study author Niklas Boers, a climate researcher at the Potsdam Institute for Climate Impact Research in Germany.

Ref 2: Climate crisis: Scientists spot warning signs of Gulf Stream collapse, 05 Aug, 2021

Climate scientists have detected warning signs of the collapse of the Gulf Stream, one of the planet’s main potential tipping points.

The research found “an almost complete loss of stability over the last century” of the currents that researchers call the Atlantic meridional overturning circulation (AMOC). The currents are already at their slowest point in at least 1,600 years, but the new analysis shows they may be nearing a shutdown.

Ref 3: Current Atlantic Meridional Overturning Circulation weakest in last millennium, Caesar, McCarthy, Thornalley, Cahill, Rahmstorf, 25 Feb, 2021

The Atlantic Meridional Overturning Circulation (AMOC)—one of Earth’s major ocean circulation systems—redistributes heat on our planet and has a major impact on climate. Here, we compare a variety of published proxy records to reconstruct the evolution of the AMOC since about AD 400. A fairly consistent picture of the AMOC emerges: after a long and relatively stable period, there was an initial weakening starting in the nineteenth century, followed by a second, more rapid, decline in the mid-twentieth century, leading to the weakest state of the AMOC occurring in recent decades.

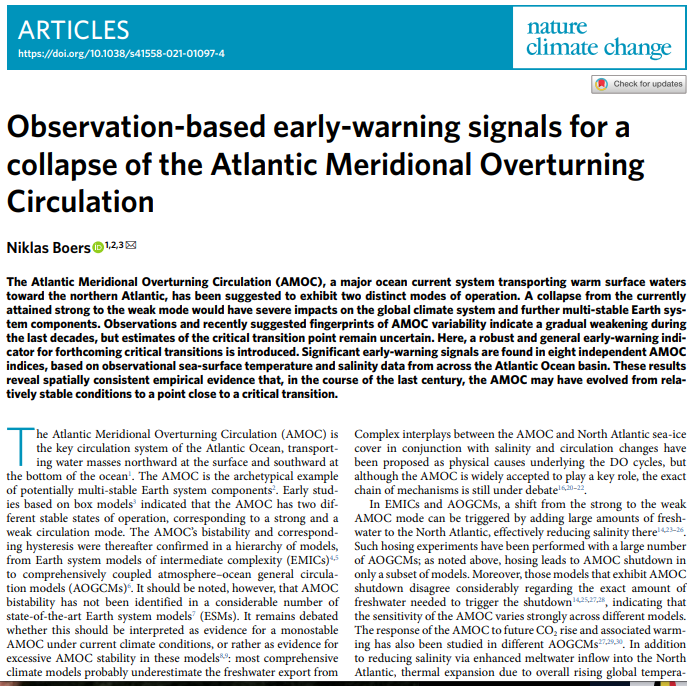
Ref 4: Observation-based early-warning signals for a collapse of the Atlantic Meridional Overturning Circulation, Niklas Boers, 05 Aug, 2021

The Atlantic Meridional Overturning Circulation (AMOC), a major ocean current system transporting warm surface waters toward the northern Atlantic, has been suggested to exhibit two distinct modes of operation. A collapse from the currently attained strong to the weak mode would have severe impacts on the global climate system and further multi-stable Earth system components. Observations and recently suggested fingerprints of AMOC variability indicate a gradual weakening during the last decades, but estimates of the critical transition point remain uncertain.

Here, a robust and general early-warning indicator for forthcoming critical transitions is introduced. Significant early-warning signals are found in eight independent AMOC indices, based on observational sea-surface temperature and salinity data from across the Atlantic Ocean basin. These results reveal spatially consistent empirical evidence that, in the course of the last century, the AMOC may have evolved from relatively stable conditions to a point close to a critical transition.

Advertisement
Posted in a Climate | Tagged , , , , , , , , , | Leave a comment

Biodiversity Loss, Insect Apocalypse, Marine Heatwaves and Deoxygenation, Trans-Species Viral Risks

Biodiversity Loss, Insect Apocalypse, Marine Heatwaves and Deoxygenation, Trans-Species Viral Risks // May 7, 2022

I chat about ongoing loss of biodiversity around the planet, since we never seem to talk enough about or acknowledge this ongoing catastrophe to the plants and animals on Earth.

For example, the ongoing record setting heatwave in India and Pakistan has been in the news for weeks, yet, how many of you have read or heard anything about the impact on the flora (plants) and fauna (animals) in the regions subjected to this heat and high humidity?

The only effect I have heard has been the withering grain crop losses, and impacts to human food supplies. Everything discussed in the news and elsewhere is on human-centric impacts; there is next-to-nothing on the horrendous effects of the heat and drought on living ecosystems.

Humans need a planet that supports life, and as plants and animal species diminish in richness and numbers we eventually cross extinction thresholds and then ultimately face increasing risks of complete ecosystem collapse. We really don’t want to go there.

Species are migrating to the poles to seek cooler regions. As a result of these habitat changes, many more species are overlapping with other species that they did not interact with before. As a result, viruses carried by species are crossing species-barriers, allowing them to enter and mutate inside other species. Clearly, the risks of some of these viruses finding humans is ever increasing, and worsening as warming worsens. I discuss a new paper on these risks.

Ref: Mass extinction in oceans can be avoided by curbing fossil fuels,

Ref2: Climate change linked to fewer bugs, study finds, by Evan Bush:

The insects that keep the world running by pollinating plants and supporting food chains face grave risks, a new study has found.

The combination of climate change and heavy agriculture is having a profound impact on the abundance and diversity of insects, according to a study published Wednesday in the journal Nature.

In areas where substantial warming has been documented and where land has been converted for intensive agriculture — meaning it involves monoculture or the use of pesticides — insects were nearly 50 percent less abundant, and more than a quarter fewer species could be found, the study said.

Ref3: The World Has Been Losing 10 Soccer Fields of Tropical Forest Per Minute, Eric Roston

Tropical deforestation drives more than 7% of global carbon dioxide emissions, about the same share as the entire population of India. A new analysis released Thursday found that the world lost tropical forest in 2021 at a rate of about 10 soccer pitches a minute.

Last year saw a global loss of 3.8 million hectares (14,286 square miles) of tropical forest, according to the University of Maryland’s 2021 tree-cover loss data published by the World Resources Institute’s Global Forest Watch. That’s a decrease of 11% from 2020, following a 12% rise in 2019, with fire accounting for much of the year-to-year variation.
———- ———-

Ongoing Abrupt Climate Change more than DOUBLES Number of Large Tropical Storms (Cat 3 and Higher) // May 2, 2022

A new peer reviewed scientific paper that was just released this week performed a statistical study on the number of tropical storms expected under climate change in the near term future to what we have experienced in the near term past.

In most basins around the world, the number of large tropical storms of Category 3 and higher is expected to at least double, when comparing the storms in the period 2015-2050 relative to those that occurred in the period 1980-2017.

The exceptions to this are in the Bay of Bengal and the Gulf of Mexico.

Four state of the art climate models were used in this analysis, and they examined the wind speeds and return periods of the tropical storms in all the different ocean basins where they occur. Also, statistics on these storms was examined for a selection of 18 coastal cities. Tables were presented for the top ten countries experiencing the largest relative and absolute change in people exposed to Category 1 wind speed Return Periods below 100 years. Also, for the top ten countries experiencing the largest relative and absolute changes in the number of people exposed to Category 3 wind speeds.

Please donate here to support my research and videos joining the dots on abrupt climate system change and consequences.

Sincerely,

Paul (guest appearance in this video)
Shackleton (guest appearance in this video)
Newton (guest appearance in this video)
Sally Mop

Ref: A globally consistent local-scale assessment of future tropical cyclone risk, Bloemendaal, Moel, Martinez, Muis, Haigh, van der Wiel, Haarsma.

There is considerable uncertainty surrounding future changes in tropical cyclone (TC) frequency and intensity, particularly at local scales. This uncertainty complicates risk assessments and implementation of risk mitigation strategies. We present a novel approach to overcome this problem, using the statistical model STORM to generate 10,000 years of synthetic TCs under past (1980-2017) and future climate (SSP585; 2015-2050) conditions from an ensemble of four high-resolution climate models.

We then derive high-resolution (10-km) wind speed return period maps up to 1000 years to assess local-scale changes in wind speed probabilities. Our results indicate that the probability of intense TCs, on average, more than doubles in all regions except for the Bay of Bengal and the Gulf of Mexico. Our unique and innovative methodology enables globally consistent comparison of TC risk in both time and space and can be easily adapted to accommodate alternative climate scenarios and time periods.
———- ———–

Executive Summary: Human Resilience to High Heat-Humidity is MUCH Lower than 35C Wet-bulb Threshold // May 1, 2022

I wanted to reiterate some points from my last video, since they are vital for human survival in the face of extreme temperature and humidity conditions, such as those ongoing, that are brutalizing both India and Pakistan.

Satellite imagery and data collection (remote sensing) today showed that regions of India at the surface surpassed 55 C, and even reached 60 C in some parts. This type of heat is not really survivable to either man nor beast or plant.

The key point is that the wet-bulb survivability condition of 35 C with 100% humidity is a theoretical value. In practice, young healthy people exposed to warm-humid conditions can only survive outside of wet-bulb temperatures are lower than about 31 C, and when exposed to hotter-drier conditions, they can only survive wet-bulb equivalents of 25 to 28 C.

Older people, people with underlying health problems, people on medication such as antidepressants (antipsychotics), very young people (babies and toddlers), and the obese are even less tolerant of high heat and high humidity conditions, but studies need to determine exactly how less tolerant they are.

Acclimatization to warm humid climates causes some physiological changes in the human body, such as lowering core body temperature, lowering resting heart rate, and lowering skin temperatures which can make these wet-bulb temperature limits slightly higher.

Please donate to support my research and videos as I connect the dots on abrupt climate system change.
———- ———–

Please donate to here to support my research and videos as I connect the dots on the latest science of abrupt climate system change. Please do your part to help me increase viewership of these videos by sharing far and wide and often on any and all social media platforms.
———- ———-

Posted in a Climate | Tagged , , , , , , , , , , , , , , | Leave a comment

Heat Wave in India & Pakistan Hits 1 Billion: Coal to Generate Electricity for AC’s in Short Supply

Heat Wave in India & Pakistan Hits 1 Billion: Coal to Generate Electricity for AC’s in Short Supply // Apr 28, 2022

More than 1 Billion people are facing a relentless heatwave in India and Pakistan this week. Temperatures are forecast to reach 50 C (122 F) near the border of the two countries over the next few days, under what has been described as a record breaking heat dome for April.

This is happening in what is supposed to be a cooler year due to the ongoing La Niña state.

Coal supplies in India for generating electricity in electrical power plants is in short supply; demand has gone way up to power Air Conditioners to allow people to cope with the heat.

Interesting, this is mimicking the opening scenes in Kim Stanley Robinson’s recent climate fiction book called “The Ministry for the Future” in which lack of AC results in millions of heat deaths. Hopefully this does not happen, but the risks are ever increasing.

Grain crops are withering in the fields, and this is exacerbating the risks of food disruptions, on top of the global risks to grain from lack of supply by Ukraine and Russia.

Also, people are not as resilient to extreme heat as we thought. Theoretically, we thought that a wet bulb temperature of 35C (with 100% humidity) was the limit of endurance, but a recent study published by Penn State shows that even young, healthy test subjects undergoing light metabolic activity could only withstand a wet bulb temperature of about 31C, much lower than the theoretical 35C.

Please donate here, to support my research and videos as I teach you the latest climate and weather disruption science in easily understood lay-person terms.

Sincerely,
Paul
Newton
Shackleton
———- ———–

Ref: Humans can’t endure temperatures and humidities as high as previously thought, March 01, 2022, by Katie Bohn:

UNIVERSITY PARK, Pa. — As climate change nudges the global temperature higher, there is rising interest in the maximum environmental conditions like heat and humidity to which humans can adapt. New Penn State research found that in humid climates, that temperature may be lower than previously thought.

It has been widely believed that a 35°C wet-bulb temperature (equal to 95°F at 100% humidity or 115°F at 50% humidity) was the maximum a human could endure before they could no longer adequately regulate their body temperature, which would potentially cause heat stroke or death over a prolonged exposure.
———- ———-

Climate Change Emergency Protest #177

The New Gettysburg Address” April 29, 2022 Gettysburg PA USA (2 minutes). Jim McHenry.

Posted in Climate Crisis | Tagged , , , , , , | Leave a comment

Atmospheric River Attacks on West Antarctic and East Antarctic Ice Sheets, Ice Shelves, and Sea Ice

Atmospheric River Attacks on West Antarctic and East Antarctic Ice Sheets, Ice Shelves, and Sea Ice // Apr 21, 2022

In the previous video I chatted about how Atmospheric Rivers have directly contributed to the past collapses of both Larsen A and Larsen B ice shelves on the Antarctic Peninsula.

In this video I perform a more detailed analysis on how these Atmospheric Rivers (ARs) are moving to higher and higher latitudes because of abrupt climate system change, and hitting both poles with more intense, higher water content, long duration, hotter rivers of air (1 to 3 km above sea level).

I discuss three fairly recent peer-reviewed papers. The first discusses the factors involved in causing the new record low sea ice extent around Antarctica, the second details Increases in AR impacts on the West Antarctic Ice Sheet (WAIS), and the third discusses overall AR consequences to the continent as a whole. Clearly, one of the big surprises to me is the number of rainfall events around the Antarctica coastline, and it is obvious that this cannot be good for Antarctic sea ice longevity.

Please donate to here to support my research and videos as I connect the dots on the latest science of abrupt climate system change. Please do your part to help me increase viewership of these videos by sharing far and wide and often on any and all social media platforms.

Sincerely,
Paul
Shackleton, Sally, Mop
Newton (Sir Isaac)

Ref: Antarctic Sea Ice Hit a Record Low, Now Scientists Think They Know Why, By Chelsea Harvey, E&E News on April 20, 2022

Antarctic sea ice hit a stunning record-low minimum at the end of February, dropping below 772,000 square miles for the first time since satellites began observing the southern continent more than 40 years ago. * Now scientists say they’ve untangled the reasons why. * A study published yesterday in the journal Advances in Atmospheric Sciences points to a perfect storm of factors that sent Antarctic sea ice spiraling downward in the past year. Some involve natural climate cycles—while others may be influenced by human-caused climate change.

An Unprecedented Record Low Antarctic Sea-ice Extent during Austral Summer 2022, Wang, Luo, Yang, Yu, Shi & Han, April 19, 2022

Abstract: Seasonal minimum Antarctic sea ice extent (SIE) in 2022 hit a new record low since recordkeeping began in 1978 of 1.9 million km2 on 25 February, 0.17 million km2 lower than the previous record low set in 2017. Significant negative anomalies in the Bellingshausen/Amundsen Seas, the Weddell Sea, and the western Indian Ocean sector led to the new record minimum. The sea ice budget analysis presented here shows that thermodynamic processes dominate sea ice loss in summer through enhanced poleward heat transport and albedo-temperature feedback. In spring, both dynamic and thermodynamic processes contribute to negative sea ice anomalies. Specifically, dynamic ice loss dominates in the Amundsen Sea as evidenced by sea ice thickness (SIT) change, while positive surface heat fluxes contribute most to sea ice melt in the Weddell Sea.

Atmospheric river of moisture will trigger storms and tornadoes this week, By Jennifer Gray, CNN meteorologist. Updated 5:05 PM ET, Mon April 11, 2022

You may have heard of atmospheric rivers impacting the West Coast. We had several notable ones this year that brought flooding, staggering snowfall amounts to the mountains in the west, and even landslides.

Posted in a Weather | Tagged , , , , , , , | Leave a comment

HUGE: Atmospheric Rivers Triggered Collapse of Antarctic Peninsula Ice Shelves Larsen A and Larsen B

HUGE: Atmospheric Rivers Triggered Collapse of Antarctic Peninsula Ice Shelves Larsen A and Larsen B // Apr 14, 2022

A HUGE and significant new peer reviewed scientific study/paper ties the collapse of both Larsen A and Larsen B ice shelf collapses on the Antarctica Peninsula to Atmospheric Rivers (ARs).

We know that ARs we’re recently blamed for the simultaneous heat waves in the Arctic (30 C temperature anomaly) and in Antarctica (40 C temperature anomaly).

Now, this new paper I discuss shows that ARs are responsible for over 60% of large ice sheet calving events in the last two decades since they:

bring extremely warm temperatures to the ice sheets
cause extensive surface melt, followed by ice fracturing via hydrofracking forcing
remove significant sea-ice in the proximity of the ice shelves
cause large ocean swells to destabilize the ice shelves
–Basically, Atmospheric Rivers are hammering the glacial ice in both the Arctic and Antarctic, greatly increasing ice calving and melt losses.

Since this AR mechanism is not accounted for in any climate models, it represents a mechanism to greatly accelerate polar warming, ice destruction, and sea level rise.

Ref: Intense atmospheric rivers can weaken ice shelf stability at the Antarctic by Peninsula, Wille, Favier, Jourdain, Kittel, Turton, Agosta,Gorodetskaya (et al), Published: . Download PDF–14 pp. here.

The disintegration of the ice shelves along the Antarctic Peninsula have spurred much discussion on the various processes leading to their eventual dramatic collapse, but without a consensus on an atmospheric forcing that could connect these processes. Here, using an atmospheric river detection algorithm along with a regional climate model and satellite observations, we show that the most intense atmospheric rivers induce extremes in temperature, surface melt, sea-ice disintegration, or large swells that destabilize the ice shelves with 40% probability.

This was observed during the collapses of the Larsen A and B ice shelves during the summers of 1995 and 2002 respectively. Overall, 60% of calving events from 2000–2020 were triggered by atmospheric rivers. The loss of the buttressing effect from these ice shelves leads to further continental ice loss and subsequent sea-level rise. Under future warming projections, the Larsen C ice shelf will be at-risk from the same processes.


———- ———-

Atmospheric Methane Increases on a Tear + Ideas on Methods like ISA to Reduce Global Concentrations // Apr 14, 2022

Atmospheric Methane concentrations are rising like a bat out of hell.

NOAA (National Oceanic and Atmospheric Administration) just reported that atmospheric methane concentrations rose in 2021 by a record setting 17 ppm, following on the heels of the previous record setting rise of 14.7 ppm in 2020.

Isotopic studies comparing the ratio of C-13 to the more common C-12 show that most of the rise in atmospheric methane since 2006 is due to natural emissions from things like wetlands. With a warmer climate there is much more water vapour in the atmosphere, and this ends up recharging and creating new wetlands.

The La Niña of the last few years means wetter equatorial regions with larger wetlands and thus more methane emissions from microbial decomposition of organic matter in the wetlands. Since methane is a much more powerful greenhouse gas than CO2 on a molecule to molecule basis, this rise is extreme serious for amplifying climate warming. In fact the Global Warming Potential (GWP) of methane is 34x that of CO2 averaged over a hundred year timescale, and 86x over a twenty year timescale, and many reports and media still under quote these numbers in error.

The big question is what can we do, if anything, to remove methane from the atmosphere ocean system?

I chat about a couple of peer reviewed scientific papers that examine this is detail. My favourite method by far is to deploy Iron Salt Aerosols (ISA) to lower atmospheric methane concentrations, brighten low level clouds to reduce warming, and disperse iron on to the ocean surface to stimulate phytoplankton blooms to capture carbon.

These processes all occurred naturally as the Earth entered cooling ice-age periods in the deep past; and we need to trigger them now. Ice core samples in both Greenland and Antarctica show that this mineral dust had levels 4-7 times higher during these cooler periods than we have now.
———

Pole to Pole, with Paul Beckwith: Radio Ecoshock, podcast, 13 April 2022, with super host, Alex Smith:

Pole to Pole Climate Change.

Both Poles are strangely hot. Eastern Australia just had biblical rains; the Pacific Northwest too. Storms and record-setting numbers of tornadoes hammer the U.S. mid-west. This sounds like a good time to figure out what to do. From the results of thousands of scientific papers, experts at the Intergovernmental Panel on Climate Change just issued the last part of their every-five-years reports. It is called the Working Group III report – but who cares? The world is sick, broke, and at war right now.

Why is weather so strange so soon? What does the IPCC say we can do about catastrophic climate change? Paul Beckwith is the Canadian climate scientist who tracks all this. Paul has attended a couple of international climate conferences, including COP26 in Glasgow last November. He makes summaries of science for the rest of us in his popular YouTube channel.

————

——— ———-
Please consider donating to support my work. I put a lot of time and effort into researching, studying and producing my videos so that you can learn how quickly our world is changing. Donating does not need a PayPal account, but simply a credit card. Please click here.
———- ———
Posted in a Climate Change, Climate Crisis | Tagged , , , , , , , , , , , , , , , , , , , , | Leave a comment

New Report on Climate Mitigation: Assessment Report (AR6) by Working Group (WG3) of the IPCC

New Report on Climate Mitigation: Assessment Report (AR6) by Working Group (WG3) of the IPCC // Apr 4, 2022

In this video I chat about the New Report released today on Climate Mitigation; namely the Assessment Report 6 (AR6) by Working Group 3 (WG3) of the Intergovernmental Panel on Climate Change (IPCC).

To remind you, WG2 is about Adaptation and Resilience to Climate Change, while WG1 is about the Physical Basis of Climate Change.

Combined, these three reports are about 10.5 thousand pages, which is obviously an encyclopedic undertaking, and I endeavour to read them from start to finish.

This video is a very cursory look at the latest WG3 report, since although I do read quite fast, I have not been able to read the full report yet:)

My GoldenDoodle puppy Newton (as in Sir Isaac Newton) is now 12 weeks old. He is a perfect example of exponential growth. I estimate that his size doubles roughly every 2 weeks. We first met him at the breeders when he was 6 weeks old, and he was tiny!! When we picked him up and brought him home at 8 weeks he looked twice as big. At 10 weeks he had doubled again, and now at 12 weeks, sitting in my lab and licking my face he looks enormous. The three cats were bigger than him when we got him home for the first time at 8 weeks old, and now he absolutely dwarfs them. They are all getting along very well as we struggle to get into a routine with them all. It’s not easy.

I am also finding out that everything I thought I already knew about raising and training a puppy is completely incorrect. I have to start again from square one, according to my doggy advisors, and the literature.

Now that the snow in Ottawa has mostly melted, I spend several hours picking up the yard, since it became much too risky to walk around. At least the smell had vanished after a month.

Ref: Download, full report here. Climate Change 2022: Mitigation of Climate Change
———- ———-

kkkk

——— ———-

Please consider donating to support my work. I put a lot of time and effort into researching, studying and producing my videos so that you can learn how quickly our world is changing. Donating does not need a PayPal account, but simply a credit card. Please click here.
———- ———

Posted in Uncategorized | Tagged , , , , , , , | Leave a comment

Climate Change Risk Assessment: Emissions, Heat Waves, Drought, and Cascading Impacts: Chatham House

Climate Change Risk Assessment: Emissions, Heat Waves, Drought, and Cascading Impacts: Chatham House // Mar 17, 2022

I chat in detail about the excellent Chatham House report on Climate Change Risks to our society.

First I talk a bit about what Chatham House is and does. You may have heard about meetings that follow Chatham House rules, which basically mean that all ideas and topics in the meeting can be openly and publicly disseminated, but no person in the meeting can be identified and no idea can be attributed to any person. This protocol ensures that ideas can be openly and truthfully discussed without any political or peer pressure nonsense inhibitions.

I then go over the key summary and conclusions of the report, and talk about the key ideas within, relating to direct climate effects, temperature rises, heat waves and drought and direct impacts on society via food supply disruption and water disruption.

To me, the most interesting and important sections in the report are on the cascading systemic impacts of climate change on society, and the numerous cause and effect flowcharts outlining how climate disruption impacts and multiplies societal disruption in areas of finance, supply chains, armed conflict, resource wars, political instabilities, poverty, nationalism and populism; all very relevant topics two years into a pandemic that many thing is ending, with armed conflict of Russia invading Ukraine and dictator threats of nuclear conflict and chatter about the possibilities of World War III.

Please donate here to support my research and videos as I connect the dots on abrupt climate system disruption. Also to support Shackleton kitty treats, and Newton puppy treats; these two animals are vital for keeping my spirits up during these very unstable times!! Thanks for watching; see you in a few days:).
——— ———-

Ref: How many people have ever lived on earth?

Ref: Holes the size of city blocks are forming in the Arctic seafloor.

Marine scientists have discovered deep sinkholes — one larger than a city block of six-story buildings — and ice-filled hills that have formed “extraordinarily” rapidly on a remote part of the Arctic seafloor.

Mapping of Canada’s Beaufort Sea, using a remotely operated underwater vehicle and ship-mounted sonar, revealed the dramatic changes, which the researchers said are taking place as a result of thawing permafrost submerged underneath the seabed.

The changes the scientists observed occurred between 2010 and 2019, during which four mapping surveys had taken place, covering an area of up to 10 square miles (26 square kilometers).’

Posted in Major Climate Reports, Uncategorized | Tagged , | Leave a comment

Survival Saga of Shackleton the Explorers Antarctic Journey and Discovery of his Ship Endurance

Survival Saga of Shackleton the Explorers Antarctic Journey and Discovery of his Ship Endurance // Mar 11, 2022

Amazingly, Sir Ernest Shackleton ship Endurance has just been found in 10,000 feet of ice covered water in the Weddell Sea near the Antarctic Peninsula. The ship is so well preserved, it seems like it just sank yesterday. The extremely cold water lacks sea worms that eat wood, and the extremely clear water allowed two undersea drones (robots) to get crystal clear photographs of the ship. Identity of many sunken ships is very difficult, but the Endurance name and a 5 pointed star could be clearly seen on the stern of the ship, sitting upright on the ocean floor.

This story is especially meaningful to me, since I named my first cat Shackleton the Explorer.

I chat about the expedition to discovery the Endurance, about Shackleton’s expedition from 1914-1917, and about how the entire 28 person crew survived the absolutely incredible ordeal in the oceans and sea ice just off Antarctica without the loss of a single crewman.
———- ———-

Everyone Loses in the Climate Casino, October 31, 2021 (link to rest of article, here)

The analogy of a “casino” to describe climate change related catastrophes has gained some recent traction, thanks mostly to Paul Beckwith’s frequent use of this terminology in his blog posts and YouTube videos. At first, the word “casino” seems to be an appropriate metaphor. “Casino” describes the apparently random way that fires, floods, droughts, heat waves and other climate-related catastrophes are striking apparently random locations with random intensities and consequences. Pick a location and give odds for what catastrophe is going to strike there next. Spoiler: the answer is 100%.

As someone whose career was focused for over a decade in the casino industry (my casino website is advancedadvantageplay and my YouTube channel is AdvancedAdvantagePlay), I am not comfortable with this analogy. One of my primary activities as a consultant in the industry was finding legal ways to beat casino games and writing about those methods. I also devoted considerable mathematical energy to analyzing “normal” outcomes for games and identifying issues with games based on a risk-analysis of historical outcomes. My understanding of the mathematical risks associated with climate change comes directly from my understanding of risks the player and house are taking in a casino setting.

What is true (and you may have an aunt or uncle who can testify to this) is that in casinos there are always long-term winners, just by chance. There are people who don’t know anything about the games they play who just by the grace of being that lucky statistical outlier (which must exist) end up beating the house for months or years or maybe their whole lives. Someone wins the lottery. Someone hits the slot jackpot. Casinos have winners.


———- ———-

Just wanted to say hi and catch up a bit. It’s a veritable winter wonderland in Ottawa tonight, as we just had about 3 to 4 inches (7.5 to 10 cm) of very wet snow and it has stuck to all the tree branches, making them all look very spectacular.

Puppy Newton just loves the snow, so I filmed this while he was frolicking around, digging holes, running in circles, and taking in all the new sights, sounds, and smells — especially smells — as 9 week old puppies are supposed to do!!
———- ———-

———- ———–

Please donate at http://PaulBeckwith.net to support my videos as I research and study and present the latest cutting edge science on abrupt climate system change.lease consider donating to support my work. I put a lot of time and effort into researching, studying and producing my videos so that you can learn how quickly our world is changing. Donating does not need a PayPal account, but simply a credit card. Please click here.
———- ———

Posted in Adventure | Tagged , , , , , , | Leave a comment

Climate Recap around the Globe

Climate Recap around the Globe // Feb 27, 2022

I chat about recent and significant climate mayhem and extreme weather events around the globe.

There are a few puppy and cat disruptions, but not too many; please bear with me.
———- ———–

———- ———-
Please donate at http://PaulBeckwith.net to support my videos as I research and study and present the latest cutting edge science on abrupt climate system change.lease consider donating to support my work. I put a lot of time and effort into researching, studying and producing my videos so that you can learn how quickly our world is changing. Donating does not need a PayPal account, but simply a credit card. Please click here.
———- ———


Posted in a Weather, Uncategorized | Tagged | Leave a comment