Earth Energy Imbalance: How HEAT Impacts Ocean, Land, Cryosphere, Atmosphere

Earth Energy Imbalance – EEI: How HEAT Impacts Ocean, Land, Cryosphere, and Atmosphere: Part 1 of 2 // Sep 25, 2020

Human-induced atmospheric composition changes cause a radiative imbalance at the top of the atmosphere driving global warming. The Earth Energy Imbalance (EEI) is the most critical number defining the prospects for continued and accelerating global warming and climate change. Understanding the heat gain of the Earth systemparticularly how much and where the heat is distributed – is fundamental to understanding consequences like:

  • warming oceans,
  • atmosphere and land;
  • rising surface temperatures;
  • rising sea levels; and
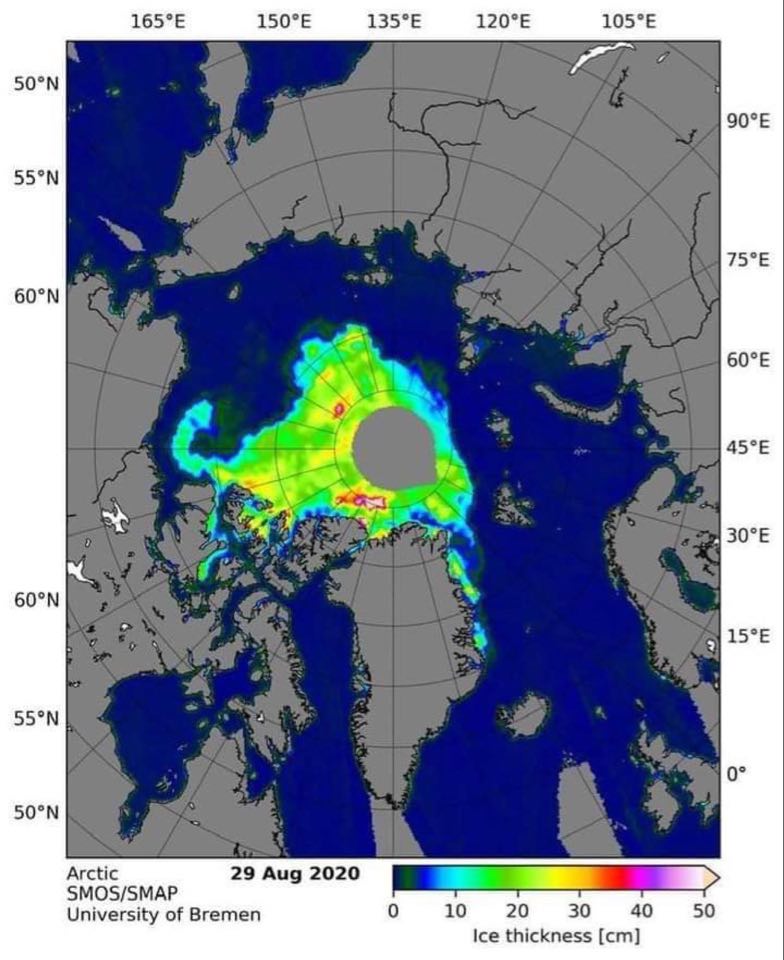
  • loss of grounded and floating ice,

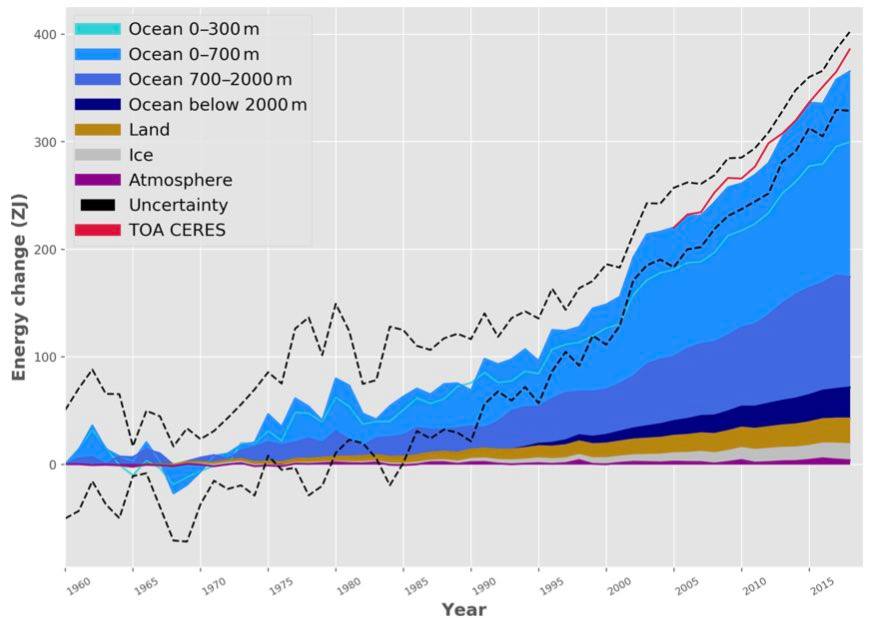
which are all fundamental concerns for society.  I chat about a new peer-reviewed study, part of Global Climate Observing System (GCOS) efforts to update Earth’s heat budget and give updated numbers on ocean warming and heat gain in the atmosphere, cryosphere and land. The long-term Earth system heat gain over the period 1971–2018 comprises a total heat gain of 358 ± 37 ZJ (Z – Zeta is 10**21) equivalent to a global heating rate of 0.47 ± 0.1 W/m2.

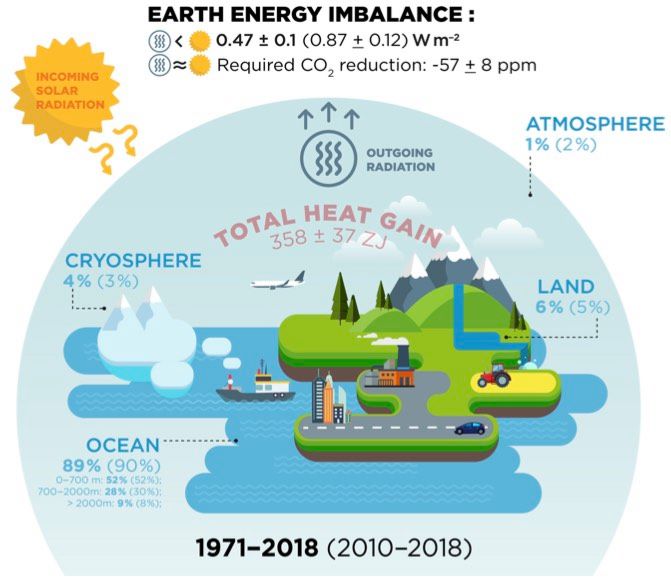
Heat distribution has the global ocean with 89%, broken down into 52% in the upper 700m ocean depths, 28% for the 700–2000m depths and 9% for below 2000m depths.

Heat gain over land amounts to 6%, 4% is available for the melting of grounded and floating ice, and only 1% is available for atmospheric warming.

EEI is not only continuing, but also increasing: it amounts to 0.87±0.12 W/m2 during 2010–2018. Stabilization of climate, the goal of the universally agreed upon United Nations Framework Convention on Climate Change (UNFCCC) in 1992 and the Paris Climate Agreement in 2015, requires that EEI be reduced to approximately zero to achieve Earth system quasi-equilibrium.

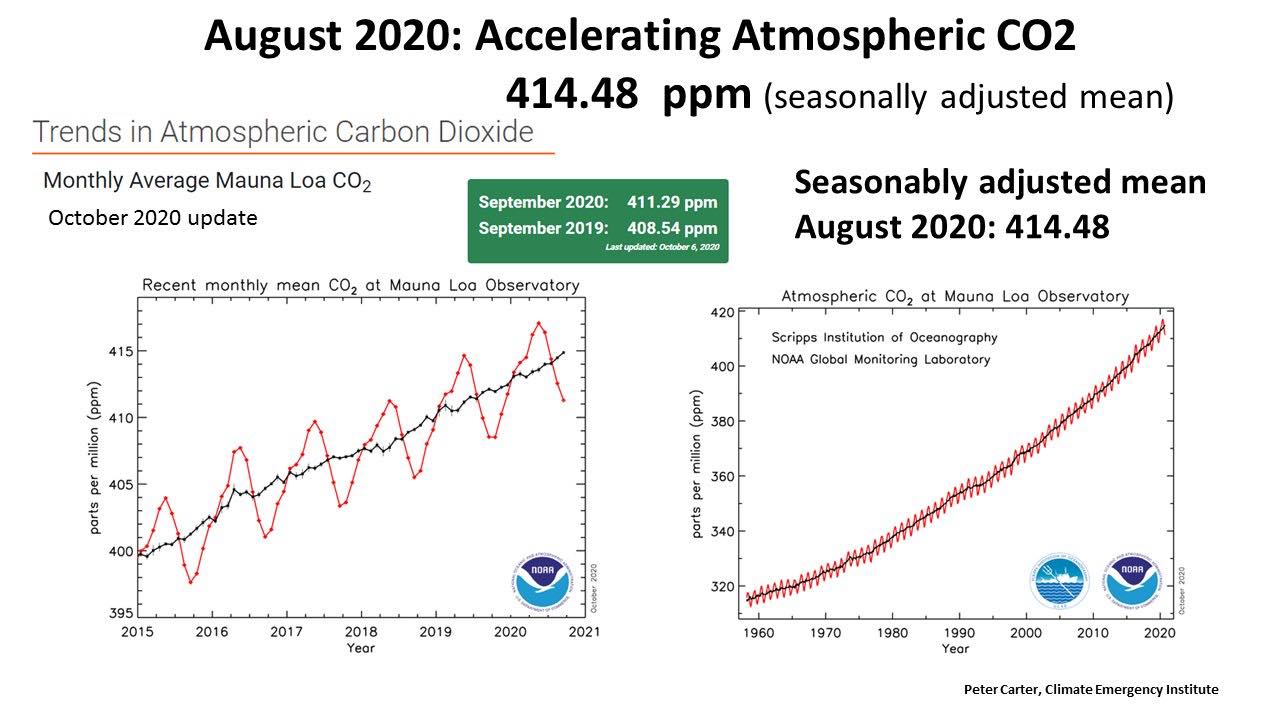
The amount of CO2 in the atmosphere needs to be reduced from about 410 ppm to 353 ppm to increase the amount of heat radiation to space by 0.87 W/m2, bringing Earth back towards overall energy balance. This simple number, EEI, is the most fundamental metric that the scientific community and public must be aware of as the measure of how well the world is doing in the task of bringing climate change under control, and we call for an implementation of the EEI into the global stocktake based on the best available science.

Continued quantification and reduced uncertainties in the Earth heat inventory can be best achieved through the maintenance of the current global climate observing system, its extension into areas of gaps in the sampling, and the establishment of an international framework for concerted multidisciplinary research of the Earth heat inventory as presented in the study.

Ref 2:  Heat stored in the Earth system: where does the energy go?
von Schuckmann, Cheng, Palmer,  Tassone, Aich, Adusumilli, Beltrami:  Earth Syst. Sci. Data, 12, 1–29, 2020.
———- ——–

Earth Energy Imbalance – EEI: How HEAT Impacts Ocean, Land, Cryosphere, and Atmosphere: Part 2 of 2 // Sep 25, 2020

Second video.

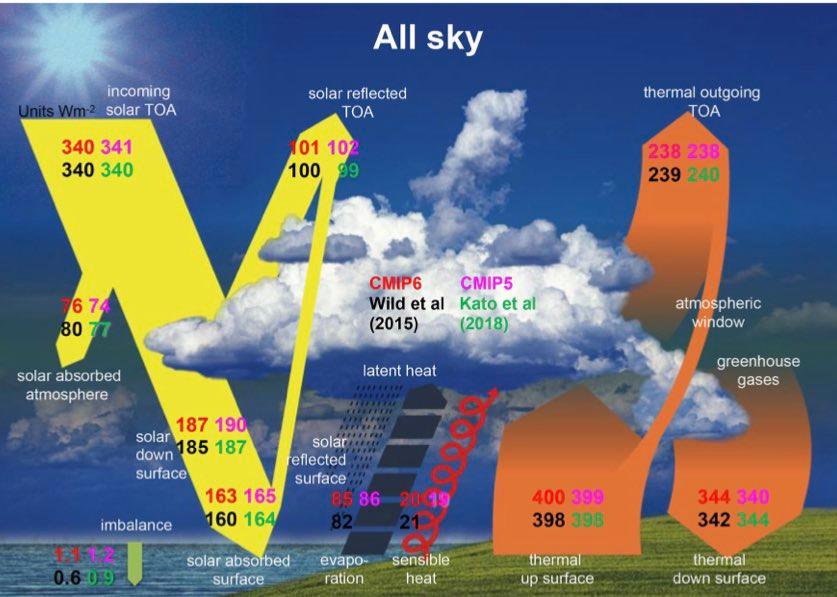
Ref 2: The global energy balance as represented in CMIP6 climate models, by Martin Wild: May 2020
——— ———-

https://twitter.com/nickconfessore/status/1314934676331663361?s=20
——— ———-

Please consider donating to support my work. I put a lot of time and effort into researching, studying and producing my videos so that you can learn how quickly our world is changing. Donating does not need a PayPal account, but simply a credit card. Please click here.
———- ———-

Posted in a Climate, a Climate Change, a Global Warming, a Rapid Climate Change, a Science, Uncategorized, zz Videos | Tagged , | Leave a comment

Equilibrium Climate Sensitivity is WORSE than Expected

How Equilibrium Climate Sensitivity is WORSE than Expected; Dependent on Initial Temperature: 1 of 3 // Oct 4, 2020

Part 1: I chat in detail in a three video series on how today’s climate and rate of change of climate related to the Eocene and PETM (Paleocene-Eocene Thermal Maximum). Despite recent advances, the link between evolution of atmospheric CO2 and climate during the Eocene greenhouse period remains unclear. Modelling studies suggest that to achieve the global warmth that characterized the early Eocene, warmer climates must be more sensitive to CO2 forcing than colder climates.

In other words, climate sensitivity (temperature vs CO2 level) depends on the starting conditions. In the new peer-reviewed paper that I discuss, they test this assertion in the geological record by combining a new high-resolution boron isotope-based CO2 record with novel estimates of Global Mean Temperature.

They find that Equilibrium Climate Sensitivity (ECS) was indeed higher during the warmest intervals of the Eocene, agreeing well with recent model simulations, and declined through the Eocene as global climate cooled. These observations indicate that the canonical IPCC range of ECS (1.5 to 4.5 °C per doubling) is unlikely to be appropriate for high-CO2 warm climates of the past, and the state dependency of ECS may play an increasingly important role in determining the state of future climate as the Earth continues to warm. In other words, we are fucked.
———- ———-

New Peer-Reviewed Research: Equilibrium Climate Sensitivity is Worse that We Thought: Part 2 of 3 // Oct 4, 2020

Second video:

Ref 1:  Nature Communications volume 11, Article number: 4436 (2020), Published: 07 September 2020:  Proxy evidence for state-dependence of climate sensitivity in the Eocene greenhouse
Anagnostou, John,  Babila, Sexton, Ridgwell, Lunt, Pearson, Chalk, Pancost Foster:

The Eocene Epoch is the most recent greenhouse period in Earth’s history. Atmospheric carbon dioxide (CO2) and temperature peaked in the early Eocene, and both declined towards the late Eocene, ultimately leading to an icehouse state at the Eocene-Oligocene Transition.

However, to better constrain the potential mechanisms driving the early Eocene warmth and the subsequent cooling, high-resolution records of CO2 and temperature are required. While obtaining continuous marine records of temperature through this interval has been an ongoing effort, similar records for CO2, are fragmented and of low temporal resolution with large uncertainties, and thus remain insufficient to fully characterize the climate dynamics of the Eocene.’
———- ———-

Paleocene-Eocene Thermal Maximum (56 million years ago) informs us on today’s Climate: Part 3 of 3 // Oct 5, 2020

Third video.

Ref 2:  ‘What Are “Proxy” Data?‘  ‘In paleoclimatology, or the study of past climates, scientists use what is known as proxy data to reconstruct past climate conditions. These proxy data are preserved physical characteristics of the environment that can stand in for direct measurements. Paleoclimatologists gather proxy data from natural recorders of climate variability such as tree rings, ice cores, fossil pollen, ocean sediments, corals and historical data. By analyzing records taken from these and other proxy sources, scientists can extend our understanding of climate far beyond the instrumental record‘.

Ref 3:  ‘The Perplexing PETM, Posted on 23 September 2014.

Rapid change and environmental turmoil
At the onset of the PETM, oceans acidified in less than 10,000 years (a geological blink) by around 0.3pH units as average surface ocean temperatures across the planet rose by 4° to 5°C (7-9°F), with the subsurface oceans warming by 5-6°C (9-11°F). Ecosystems across the world were plunged into turmoil, with poleward migrations, decline of reefs, extinctions of some sea-bottom-living creatures, and in some places 20% of land plants went extinct while plant diversity dropped by more than a third.

‘In mammals the effects included strong natural selection for small body size, and high species turnover, though there was no vertebrate mass extinction. Globally the resulting climate of the early Eocene was up to 15°C (27°F) warmer than today, supporting lush vegetation on Antarctica and the Arctic‘.
———- ———-

———- ———-

Please consider donating to support my work. I put a lot of time and effort into researching, studying and producing my videos so that you can learn how quickly our world is changing. Donating does not need a PayPal account, but simply a credit card. Please click here.
———- ———-

———- ———-

Posted in a Climate Change, a Global Warming, a Science, a Weather | Tagged , , , | Leave a comment

Salty Ocean Parts Getting Saltier; Fresher Parts Getting Fresher: From Amplified Hydrological Cycle


Salty Ocean Parts Getting Saltier; Fresher Parts Getting Fresher: From Amplified Hydrological Cycle // Sep 25, 2020


We know that as climate change accelerates wet regions of the planet are getting wetter and dry regions of the planet are getting drier.

  • In this video, I chat about new research showing that ocean regions that have high salinity (very salty) are getting even saltier (since Evaporation-E exceeds Precipitation-P),
  • while low salinity (fresher) regions are getting even fresher (salinity is decreasing since P exceeds E).

I show salinity for the ocean surface (Sea Surface Salinity – SSS) down to a depth of 2000 m (6600 feet) on a 1×1 degree grid between 1960 and 2017.

The Salinity Contrast (SC) (maximum-minimum) has increased by 7.5% at the surface (SC0), 2.9% between 0 and 1000 m (SC1000) and increased 1.6% between 0 and 2000 m (SC2000). These contrast amplifications are caused by the global hydrological cycle intensifying by between 2 to 4% between 1960 and 2017.
——————

———- ———-

Please consider donating to support my work. I put a lot of time and effort into researching, studying and producing my videos so that you can learn how quickly our world is changing. Donating does not need a PayPal account, but simply a credit card. Please click here.
———- ———-

https://twitter.com/Rainmaker1973/status/1309583129770950659?s=20

Posted in a Climate, a Climate Change, a Oceans, a Rapid Climate Change, a Science, a Weather, Basic Science, Oceanography, Uncategorized | Tagged , , , , | Leave a comment

How Tropical Cyclones, Hurricanes, Typhoons Change the Strength and Waviness of Jet Streams

How Tropical Cyclones, Hurricanes, Typhoons Change the Strength and Waviness of Jet Streams: 1 of 3 // Sep 17, 2020

My main intention in this 3 part video series is to show you how large cyclones (hurricanes, tropical cyclones, typhoons, even medicanes) interact with the jet streams, and can either:

  • Add energy to them (amplify them) or
  • Take energy from them, depending on their size, extent, rotation direction, and proximity to ridges and/or troughs.
  • The modified jet stream (faster or slower; wavier or less wavy; streakier or more uniform)) that results from this interaction then propagates thousands of miles downstream and changes weather there.

Specifically, I show how the strong tropical cyclones that hit the Japan, South Korea region amplified the ridges and troughs of the jet stream, which then propagated downstream over many days and then caused a record breaking weather whiplashing from record warm temperatures in parts of Colorado to freezing temperatures and even snowfall.

It is clear that the jet stream, which guides storms, can have high amplitude ridges and troughs that can break off the jet stream (cutoff lows, for example) generating cyclones, and now it should be clear that cyclones can themselves modify the jet streams by interacting with them.

Yes, the dog wags it’s tail, but clearly the moving tail can also wag the dog!!

Ref:  Suddenly in Second Place, 16 Sept, 2020, NSICD.

In the first week of September, sea ice extent took a sharp downward turn, exceeding the pace of decline for any previous year during that period, and placing the 2020 sea ice minimum firmly as second lowest—after 2012—in the 42-year continuous satellite record. Pulses of warm air from north-central Siberia are responsible for the late downward trend. Sea ice decline has slowed in the past few days, and the annual minimum is imminent.’
———- ———-

In front of a small bookstore in Perth, Ontario

———- ———-

https://twitter.com/HolyCow_Inc/status/1306243972243902465?

Perfect example of a tipping point,
in more ways than one:)

———- ———-

Please consider donating to support my work. I put a lot of time and effort into researching, studying and producing my videos so that you can learn how quickly our world is changing. Donating does not need a PayPal account, but simply a credit card. Please click here.

Editor / dk:  Paul as a rule eschews public mentions of jubilees on view counts and site visits, but seems more than fair, as we enter our sixth year of five to date, to mention that Paul’s YouTube channel hit five million views a week or so ago, with over twenty-one thousand subscribers now, with certainly well over 600 videos.

And here–at this website–we topped half a million views this summer (now closer to 600k), with 258k discreet visitors, over 26,000 followers, and spread over 189 countries and principalities.  This is upon 372 posts or just slightly below, 1.3 posts per week.

Google indicates Paul, on a back of napkin calculation, as showing up in 4.76M citations or mentions.  Of course, this can vary by accuracy or quality, but some are very good and his mark is clear.  Homeland Security, repeatedly mentions Paul in the same breath as Dr Peter Wadhams, Michael C. Mann, James E. Hansen, Jason Box (regular and current private communication, with key intel, which has THE highest regard for Paul.  He is stated as seen as among the best.  You can bet your life on it).

On his twitter, Paul Beckwith has over 23,000 followers, and is an excellent and steady source of among THE best annectdotal information on climate.  He dependibly posts regular updates.

Lastly, your donations revert to ALL of Paul’s work, and he makes it easy for you, to be able to quickly and conveniently obtain broad scientific climate information, in a way which is easy, cogent, and fast, as well as entertaining.  He  certainly works tirelessly hard.  We thank all of you on behalf of Paul, his team, and supporters.  All ofthis is because of YOU.
———- ———-

https://twitter.com/aubreygci/status/1306595783735537666?s=20

Posted in a Climate, a Climate Change, a Global Warming, a Rapid Climate Change, a Science, Uncategorized | Tagged , , , , | Leave a comment

Find Out Soon, How Low Will the Big Arctic Ocean Slushy Go

Paul Beckwith: Post-doom with Michael Dowd // Sep 6, 2020

This conversation with climate systems scientist and abrupt climate change expert, Paul Beckwith, was recorded August 31, 2020.
——— ———–

Most damaging atmospheric rivers 1978–2017

How Low Will the Big Arctic Ocean Slushy Go; We Will Find Out Very Soon… / Sep 8, 2020

In this third of a new series of Arctic sea ice demise videos I continue to chat about the demise of the big slushy in the Arctic Ocean. I discuss:

  • in detail the recent peer reviewed scientific papers on how Atlantic Water (dense, warmer water a couple hundred of meters below the sea ice) has moved to within 80 meters of the bottom of the sea ice in the Eastern Euro Basin,
  • and will likely keep the ocean from freezing up there in the winter.
  • The heat in their Atlantic Water is enough to completely melt out the entire Arctic Ocean ice three or four times over, as it eventually makes it near the surface over the entire basin.
  • This already happens in the Barents Sea region, and is spreading eastward into the rest of the Arctic.

I am also discussing how the so called “chimneys” where the Arctic Ocean water descends to complete the AMOC (Arctic Meridional Overturning Circulation), and how this process is being disrupted by Atlantification, thereby weakening the thermohaline process leading us closer to a complete shutoff and then redistribution of global ocean circulation patterns. 2020 is continuing to be full of unpleasant surprises for the teeming masses of humanity on Earth.

Ref: ‘Growing underwater heat blob speeds demise of Arctic sea ice
By Paul Voosen. Aug., 25, 2020 , 1:30 PM:

In March, soon after arriving aboard the Polarstern, a German icebreaker frozen into Arctic sea ice, Jennifer Hutchings watched as ice broke up around the ship, weeks earlier than expected. Even as scientists on the research cruise scrambled to keep field instruments from plunging into the ocean, Hutchings, who studies ice deformation at Oregon State University, Corvallis, couldn’t suppress a thrill at seeing the crack up, as if she had spotted a rare bird. “I got to observe firsthand what I studied,” she says.

Risk of Atmospheric River Caused California Megaflood Three Times Higher With Abrupt Climate Change‘, Paul Beckwith video.

Ref 2:  ‘Atmospheric rivers drive flood damages in the western United States‘, Corringham, Ralph, Gershunov, Cayan, Talbot, 19 Dec, 2019.  Link to downloadable PDF is here.

Atmospheric rivers (ARs) are temporally ephemeral filamentary features in the lower troposphere that horizontally transport large quantities of water vapor (on average, more than double the flow of the Amazon River) and can cause extreme precipitation events on west coasts of major landmasses due to orographic lift over mountainous topography.’
———- ———-

https://twitter.com/kareem_carr/status/1303360976197242881?s=20
———- ———-

Please consider donating to support my work. I put a lot of time and effort into researching, studying and producing my videos so that you can learn how quickly our world is changing. Donating does not need a PayPal account, but simply a credit card. Please click here.
———- ———-

Posted in a Climate, a Climate Change, a Rapid Climate Change, a Science, Interviews, Uncategorized | Tagged , , , | Leave a comment

Going, Going. Arctic Sea Ice Soon to be Gone

Arctic Sea Ice Status: Going. Going. Soon to be Gone // Sep 3, 2020

In this first of a new series of videos I chat about Arctic Sea Ice. We are approaching the yearly minimum, and it is a toss up as to whether or not we will set a new record, beating out 2012 or be a close second. A huge difference is that in 2012 we had solid ice remaining, whereas this year we only have an ocean of slush remaining, with thickness essentially 30 cm or so (one foot).

In this video series I will discuss in detail the recent peer reviewed scientific papers on how Atlantic Water (dense, warmer water a couple hundred of meters below the sea ice) has moved within 80 meters of the bottom of the sea ice in the Eastern Euro Basin, and will likely keep the ocean from freezing up there in the winter. The heat in their Atlantic Water is enough to completely melt out the entire Arctic Ocean ice three or four times over, if it eventually makes it near the surface over the entire basin.

Ref: Universitat Bremen, Nasa WorldView.
———- ———-

———- ———-

Please consider donating to support my work.  I put a lot of time and effort into researching, studying and producing my videos so that you can learn how quickly our world is changing.  Donating does not need a PayPal account, but simply a credit card. Please click here.
———- ———-

———- ———-

Posted in a Global Warming, a Rapid Climate Change, a Science, a Weather, Uncategorized | Tagged , | 1 Comment

Record High Greenland Ice Sheet Melt

Record High Greenland Ice Sheet Melt // Aug 25, 2020

Years with near record lows of Arctic sea-ice are often associated with a persistent jet stream ridge (blocking high) over Greenland. This means very low snowfall in the winter to build up the ice thickness, and very warm, cloud free summers to accelerate the Greenland ice sheet surface melting and discharge (comprised of calving of the ice shelves, and submarine loss melting from below where the warm ocean waters contact the lower ice surfaces). Greenland lost a record 532 GT of ice in 2019, surpassing the previous record melt year in 2012 (when sea ice set a record low) by 15%.

Ref: to two other, recent videos (three with immediate, above): COVID-19 Dashboard by the Center for Systems Science and Engineering (CSSE) at Johns Hopkins University (JHU)


Ref2:  ‘Greenland’s melting ice sheet – in pictures‘, Guardian 20 Aug, 2020
———- ———-

———- ———-

Please consider donating to support my work.  I put a lot of time and effort into researching, studying and producing my videos so that you can learn how quickly our world is changing.  Donating does not need a PayPal account, but simply a credit card. Please click here.
———- ———-

———- ———-

Posted in a Climate, a Climate Change, a Global Warming, a Rapid Climate Change, a Science, Uncategorized | Tagged , , , | 2 Comments

Comparing Contemporary Abrupt Arctic Climate Change to Paleoclimate Dansgaard-Oeschger Oscillations

Comparing Contemporary Abrupt Arctic Climate Change to Paleoclimate Dansgaard-Oeschger Oscillations // Aug 21, 2020

The ongoing rapid destruction of Arctic sea-ice is having profound effects on our overall climate system, and will soon likely reduce our ability to grow food. I chat on the latest science comparing our present day (contemporary) abrupt Arctic climate change to abrupt changes in past Arctic paleorecords captured in Greenland Ice Cores, namely rapid warming during the Dansgaard-Oeschger (D-O) Oscillations.

Arctic warming over 1 degree C per decade is considered to be abrupt, and values 2.5x that occur in some regions now and in the past.

Ref: Past perspectives on the present era of abrupt Arctic climate change, Published: 29 July 2020.  Jansen, Hesselbjerg Christensen, Dokken, Nisancioglu,
Nature Climate Change volume 10, pages, 714–721. 2020:

Abstract:  ‘Abrupt climate change is a striking feature of many climate records, particularly the warming events in Greenland ice cores. These abrupt and high-amplitude events were tightly coupled to rapid sea-ice retreat in the North Atlantic and Nordic Seas, and observational evidence shows they had global repercussions. In the present-day Arctic, sea-ice loss is also key to ongoing warming.

‘This Perspective uses observations and climate models to place contemporary Arctic change into the context of past abrupt Greenland warmings. We find that warming rates similar to or higher than modern trends have only occurred during past abrupt glacial episodes. We argue that the Arctic is currently experiencing an abrupt climate change event, and that climate models underestimate this ongoing warming‘.

Ref2:  Currently, downloadable, PDF of same as above.
———- ———-

Abrupt Arctic Climate Change: Comparison of Today with Paleoclimate: Change Rates and Distribution // Aug 21, 2020

During the last glacial period from 120,000 to 11,000 years ago, there were over 20 abrupt periods of rapid warming (D-O Oscillations) exceeding 1 degree C per decade warming recorded in the North Greenland Ice Project (NGRIP) cores.

I continue to chat about the latest science comparing both the rates of change of warming as well as the spatial distribution of the warming between these D-O events and present day (contemporary) Arctic warming. In the paleoclimate D-O warming events, large Greenland ice sheet melting was preceded by extensive loss of Arctic sea ice; a pattern that we are expecting to experience again.
———- ———-

———- ———-

Please consider donating to support my work.  I put a lot of time and effort into researching, studying and producing my videos so that you can learn how quickly our world is changing.  Donating does not need a PayPal account, but simply a credit card. Please click here.
———- ———-

———- ———-

Posted in a Climate, a Global Warming, a Rapid Climate Change, a Science, Uncategorized | Tagged , , , | Leave a comment

Greenland Tragedy, Fractured Sea Ice at Mercy of Wind, Waves, Currents, Sun

Arctic Sea Ice Status Update, and a Tragedy in Greenland // Aug 14, 2020

We are 4-5 weeks away from our yearly Arctic Sea Ice mid-September minimum. I chat on present Arctic sea ice status and loss trends. Gone are days of thick, solid, contiguous ice. We now have a regime where sea ice is fractured, broken, thin, and easily jostled around by wind, ocean currents, and waves. Sensors measuring ice extent, area, and thickness struggle to provide accurate info in this new fractured regime.

I also discuss the extremely sad, tragic loss of Swiss glaciologis Konrad Steffen in a Greenland crevasse

Ref: Konrad Steffen, Who Sounded Alarm on Greenland Ice, Dies at 68, NYT 8/13/2020
———- ———-

Fractured, Thin, Broken Arctic Sea Ice Subject to Mercy of Wind, Waves, Ocean Currents, and Sun // Aug 14, 2020

The state of Arctic Sea Ice this 2020 summer is that of an ocean of ice cubes. The ice is very fractured, essentially broken up into small ice chunks and tossed around at the mercy of the wind and waves (and ocean currents).

The ice loss is occurring on many fronts. There is ongoing export from the Arctic Ocean via the Fram Strait, and through the Canadian archipelago. Melting from above is still intensive via solar radiation which is at about half the summer peak. Extremely warm water temperatures at the ice fringes and below the ice are also very significant.
———- ———-

Featured at ScientistsWarning.org:  ‘The Arctic in Free Fall

We are hurtling towards the Blue Ocean Event (BOE) in the Arctic. Nobody knows for sure when it will happen. From my analysis, which I discuss in this video, my best guess is that the BOE will happen in 2022. After this BOE happens, then what will follow in subsequent years? I think that by BOE+2 years the Arctic Ocean will be ice free for August, September, and October. By BOE+4 years it will be ice free for 5 months, and by BOE+10 years the Arctic Ocean will be free of sea ice year round.” – Paul Beckwith, Climate Systems Scientist

———- ———-

Please consider donating to support my work.  I put a lot of time and effort into researching, studying and producing my videos so that you can learn how quickly our world is changing.  Donating does not need a PayPal account, but simply a credit card. Please click here.
———- ———-

———- ———-

Posted in a Climate, a Global Warming, a Rapid Climate Change, a Science, Uncategorized | Tagged , , , , , , , , , | Leave a comment