First Arctic Blue Ocean Event: What Computer Simulations and Statistical Trend Analysis Tells Us // Apr 6, 2020
In this video and the next, I continue my examination of Arctic sea ice data which gives us a clear picture of its present state and clearly shows the relentless downward trends in extent, thickness, and volume that allows each of us to draw our own conclusions about when it will vanish in a Blue Ocean Event (BOE). It is just a matter of time before the ice vanishes, but how much time are we talking about? I give my own educated opinion (guess), and draw on some recent peer-reviewed scientific papers that attempt to narrow down the timing of the first BOE, from both computer modelling simulations and statistical trend analysis.
———– ———-
Arctic Blue Ocean Event: Timing Gleamed from Statistical Trend Analysis and Computer Simulations // Apr 6, 2020
Second video, continues from above.
———– ———-
Horrifyingly Simple Math: USA Coronavirus Cases to Soon EXCEED Total of Cases in Rest of the WORLD // Apr 6, 2020
Instead of MAGA (Make America Great Again) the US leadership has MAGI (Make America Gravely ill). Ontario just released its virus mortality expectations of between 3,000 and 15,000 people, down from an expected 100,000 due to measures taken. We can do the opposite calculation with Trump (in a future video), and estimate the number of deaths in the US attributable to his denial, misinformation, and bungling.
But for this video, I compare :
- a) the ratio of US cases to the rest of the world, and
- b) the ratio of US cases to the world total.
- As of April 5th a) was over 35% and b) was almost 26%. If trends continue; there will soon be more cases in the US then in the total rest of the world added up together. Horrifying, and completely avoidable with a competent leader.
———– ———-
Sounds from a Million Ice Crystals Jiggling in the Waves: Frazil Ice on the Ottawa River in Spring // Apr 6, 2020
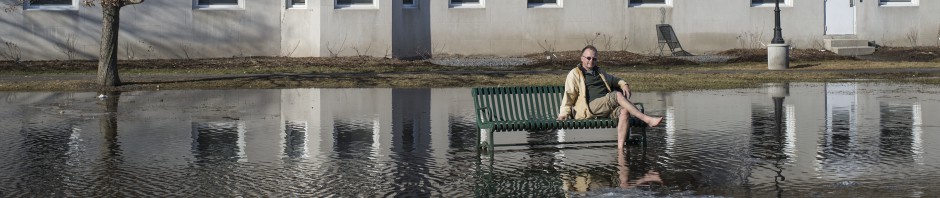
I found the Perfect Social (Physical) Distancing Spot on a Breakwater on the Ottawa River today: there isn’t a soul within many hundreds of meters of me; it’s just me and the Sun and the Waves and the River and the Fresh Spring Air. There is no better way to spend some time.
Steady Westerly Breeze generated waves have shredded many of the remaining remnants of river ice into tiny ice crystals (Frazil Ice), which create beautiful, somewhat eerie and haunting sounds as they collide into each other under the mechanical churning of the waves.
I cycled to this spot; only 26 km (16 miles) round trip today, a rest from my Saturday trip of 114.4 km (71.1 miles). Nothing beats great exercise for lifting ones spirits during this time of abrupt climate change and coronavirus pandemic.
———– ———-
———- ———–
Please consider donating to support my work. I put a lot of time and effort into researching, studying and producing my videos so that you can learn how quickly our world is changing. Donating does not need a PayPal account, but simply a credit card. Please click here.
———- ———-
https://twitter.com/blkahn/status/1247164596198223872?s=20
https://twitter.com/ayanaeliza/status/1247323771003973635?s=20


I wonder whether there is a new El Nino forming that will mature late this year and next year (I read different forecasts about this), and whether such an El Nino would have an accelerating impact upon Arctic warming and the BOE.
LikeLike
Pingback: Logic 101: COVID-19 Spreading Characteristics: What We Know | Paul Beckwith, Climate System Scientist
Atmospheric CO2 has reached 418 ppm as of 1 May: https://www.co2.earth/daily-co2
LikeLike