
Rise of The METHANE; Latest Science on Temporal and Spatial Variations: 1 of 2 // Feb 26, 2019
Since 2007 atmospheric methane concentrations have risen strongly; average rate 7 ppb per year. Methane’s Global-Warming Potential multiplies warming vs. CO2 by 34x, 86x, and 150-200x on time scales of 100 years, 20 years, and a few years, respectively.


Total radiative forcing of methane is rapidly catching that of CO2, making Paris targets nearly impossible to reach without emergency actions.

Here, and next video, I chat on latest methane science; including spatial and temporal variation, isotopic changes, emission locations, etc…
———- ———–


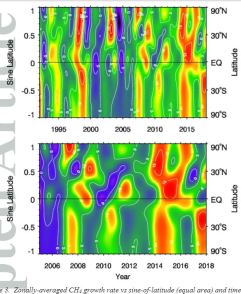
Rise of the METHANE Over Time and Latitude: 2 of 2 // Feb 28, 2019
Second video in same series on rise of Methane.

Ref: Very strong atmospheric methane growth in the four years 2014‐2017: Implications for the Paris Agreement
Nisbet, Manning, Dlugokencky,Fisher, Lowry: First published: 05 February 2019:
‘The increase in the methane burden began in 2007, with the mean global mole fraction in remote surface background air rising from about 1775 ppb in 2006 to 1850 ppb in 2017. Simultaneously the 13C/12C isotopic ratio has shifted, in a new trend to more negative values that have been observed worldwide for over a decade.
‘The causes of methane’s recent mole fraction increase are therefore either a change in the relative proportions (and totals) of emissions from biogenic and thermogenic and pyrogenic sources, especially in the tropics and sub‐tropics, or a decline in the atmospheric sink of methane, or both. Unfortunately, with limited measurement data sets, it is not currently possible to be more definitive.
‘The climate warming impact of the observed methane increase over the past decade, if continued at >5 ppb/yr in the coming decades, is sufficient to challenge the Paris Agreement, which requires sharp cuts in the atmospheric methane burden‘.
———- ———–

Ref: The Evolution of Radiative Forcing Bar-Charts, Filed under: Climate Science Greenhouse gases IPCC — gavin @ 7 October 2013:
‘As part of the IPCC WG1 SPM (pdf) released last Friday, there was a subtle, but important, change in one of the key figures – the radiative forcing bar-chart (Fig. SPM.4). The concept for this figure has been a mainstay of summaries of climate change science for decades, and the evolution over time is a good example of how thinking and understanding has progressed over the years while the big picture has not shifted much.’
———- ———-
———- ———–
Please consider donating to support my work. I put a lot of time and effort into researching, studying and producing my videos so that you can learn how quickly our world is changing. Donating does not need a PayPal account, but simply a credit card. Please click here.
———- ———-


Well i got up and heard the tornado damage in the south. Paul was right,the tornados are moving out of the plains and heading east with every year. More dead from one tornado than all of them last year!!
Time people get their heads out of whatever butts they have it in( politics,facebook,economy) and start listening to our climate scientists. Climate change cannot be laughed at any longer. Educate and teach.
LikeLike