We NEED Climate Operation Warp Speed: We’re close to a Terrestrial Biosphere Tipping Point

We NEED Climate Operation Warp Speed: We’re close to a Terrestrial Biosphere Tipping Point: 1 of 2 // Mar 18, 2021

Humanity desperately needs a Climate Operation Warp Speed (COWS). Earthlings must pull out all stops, and work relentlessly until COWS comes home to Earth.

We did it for the coronavirus. The average time to develop a new vaccine is ten years. Since big governments around the planet pushed hard to develop vaccines, it took less than a year, and we know have multiple working vaccines (20? 30?)

Governments around the world put in multi-billion dollar preorders for vaccines, and ongoing deployment logistics to a large fraction of countries population is still ongoing. Science was prepared, with DNA based development, and perhaps lucky. Global cooperation resulted in the fasted vaccine mobilization in history, by an order of magnitude (10x).

This should be a lesson. When facing a world-threatening crisis, there are no substitutes for government leadership. It makes me feel better about our chances in diverting a comet or asteroid if we find one will hit us in a decade or two. Why can’t government do this for our climate crises.

We need COWS. We need COWS.

We will not rest until COWS come home!

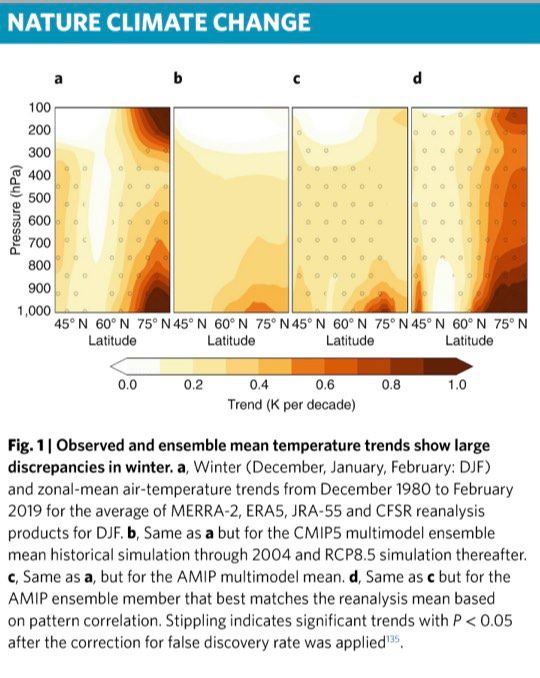
There is no time to waste. We are extremely close to a temperature tipping point for the terrestrial biosphere. Our land sink presently captures about 30% (2.6 PgC per year) of our yearly anthropogenic carbon emissions. With Business-as-Usual (BAU) keeping us on the highest emission scenario (RCP8.5) the land temperatures will cause our land carbon sink to become a net carbon source by about 2040, and then atmospheric and ocean carbon will skyrocket.

I discuss the latest science on C3 (most plants) having a photosynthesis maximum at 18C, and C4 plants (grasses, corn) having the maximum at 28C. The mean temperature of the warmest quarter of the year (3 months) passed the thermal maximum for photosynthesis within the last decade. With BAU the land sink capture will halve to only 15% of anthropogenic emissions and the overall land surface will tip to a source.

In Part 1 of my two part video series, I chat about the key highlights of the terrestrial tipping point science.

In Part 2 I delve into the graphs and nitty gritty of the science and why we can expect the land to tip over from a net carbon sink to a carbon source within two decades or so.
———- ———-

Earth Catastrophe Warning to the World: The 2021 Climate Change Science: Part 1 of 4 // Mar 16, 2021

When I presented at COP25 (Conference of Parties 25th edition) in Madrid, Spain I worked a lot with Peter Carter, Regina Valdez, Heidi Brault, Charles Gregoire, and of course the amazing Stuart Scott.

All of the videos that I filmed are of course on my blog http://paulbeckwith.net​ and on my YouTube channel Paul Beckwith. Peter, of course, has his amazingly detailed website called Climate Emergency Institute and Stuart (with huge help from Heidi and Charles) has his called Facing Future Earth while Regina does a lot of great work with Climate Reality.

In preparations for COP26 in Scotland or virtual, depending of the course of the virus this year, the gang and I are putting out a video a week under our new group name Climate Emergency Forum.

In this first video of a four part series, I go through key points on a subsection of Peter’s website called 2021 Climate Science World Warning https://www.climateemergencyinstitute…​ where an initiative to warn key decision makers in governments and the United Nations is ongoing.

My main focus in this video series is to discuss in detail the main points in Peter’s 90+ slide deck called 2021 Climate Science World Warning https://files.secure.website/wscfus/8…​ Topics include:

– Earth’s Sixth Mass Extinction Acceleration
– Cumulative atmospheric carbon dioxide, methane, nitrous oxide, and carbon dioxide equivalent are all tracking or exceeding the UN IPCC worst case scenario
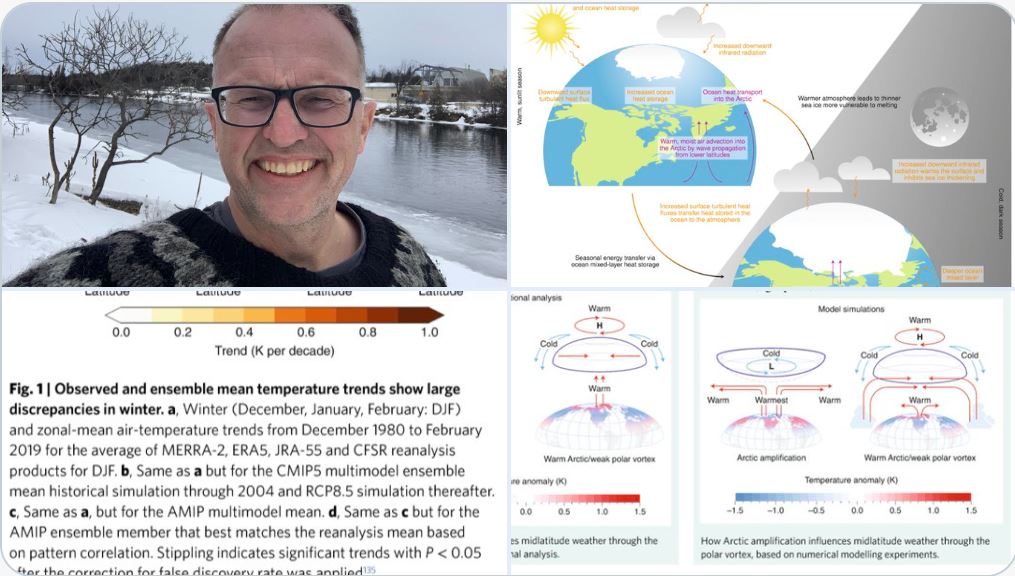
warming of the planets atmosphere, land, and oceans are all setting new record limits as they inexorably rise at accelerating rates
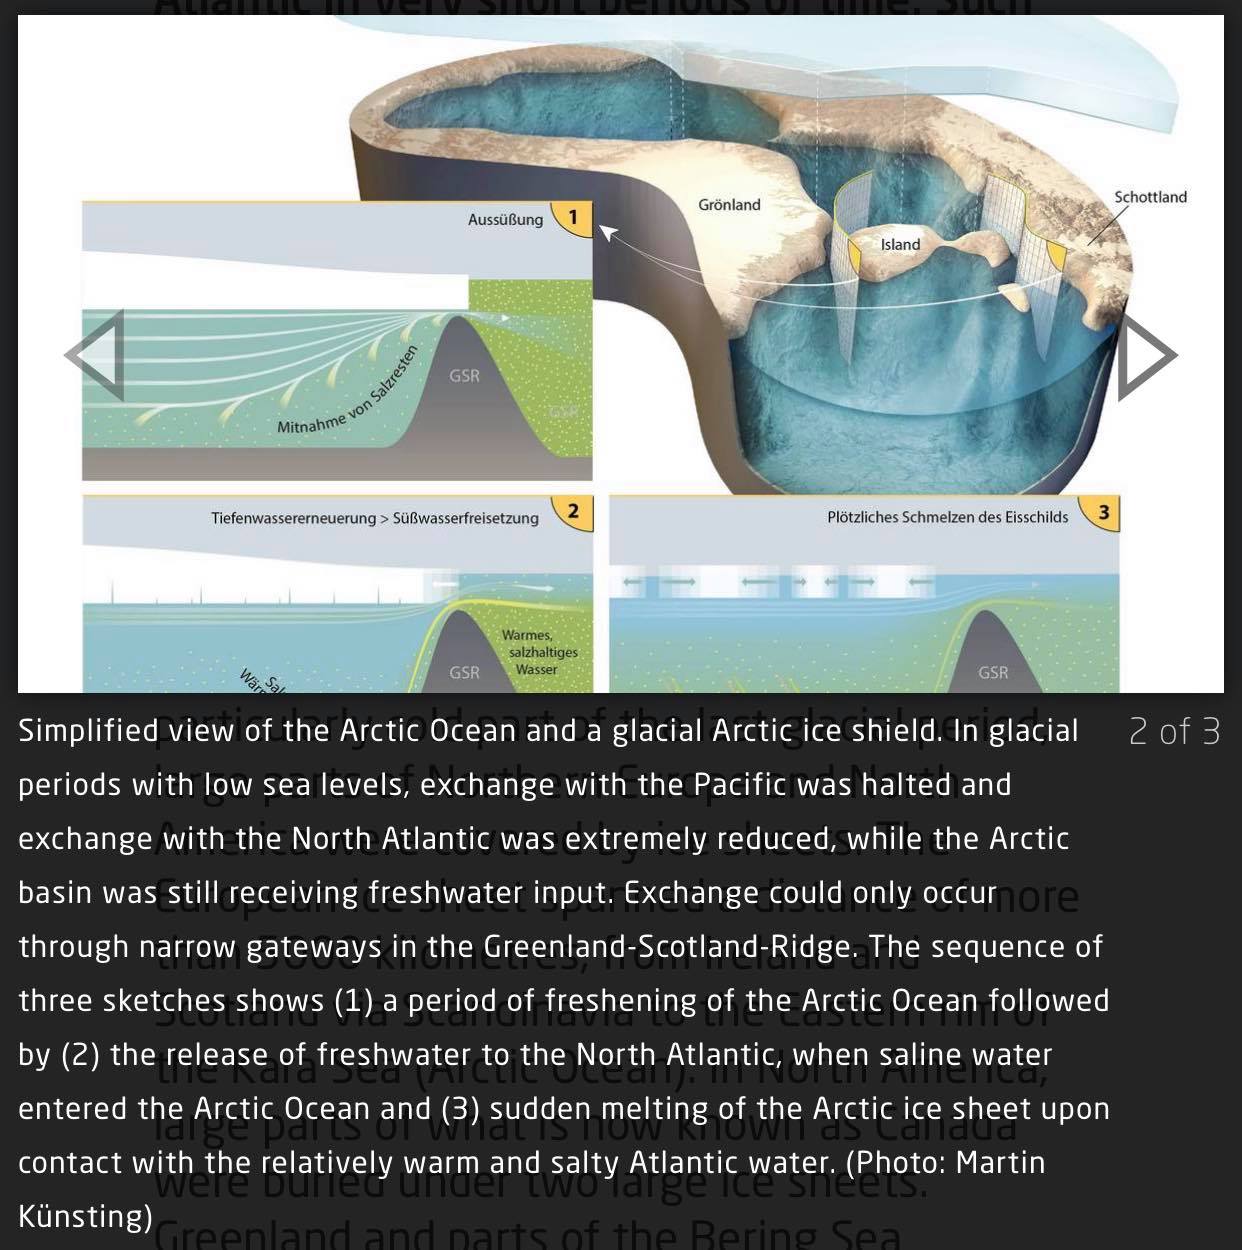
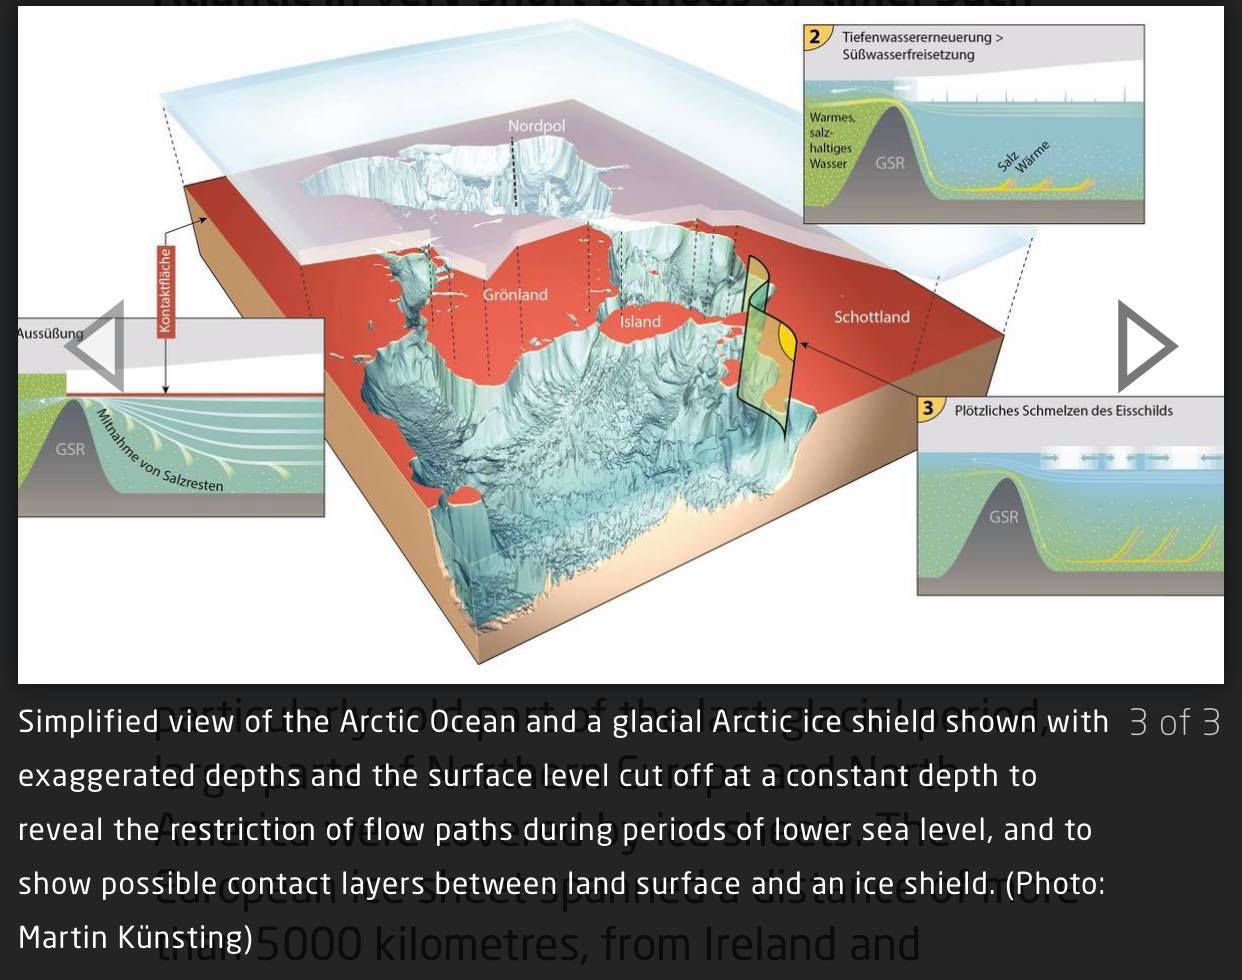
– Arctic changes are the fastest on the planet and have huge risks to our societies and global ecosystems .

Soon I will post an searchable Excel Spreadsheet index of all my video topics, release dates, etc. and update it frequently. Please help me get the word out by emailing, Facebooking, Twittering, LinkedInning, Instagramming, Redditing, and Quoruming, etc. all my stuff!!!

———- ———-

Please consider donating to support my work. I put a lot of time and effort into researching, studying and producing my videos so that you can learn how quickly our world is changing. Donating does not need a PayPal account, but simply a credit card. Please click here.
———- ———-

Posted in a Climate, a Science | Tagged | Leave a comment

Underestimating Challenges for Avoiding a Ghastly Future

My 7th Birthday

Underestimating Challenges for Avoiding a Ghastly Future: Part 1 of 2 // Mar 11, 2021

Recently a peer reviewed scientific paper titled “Underestimating the Challenges of Avoiding a Ghastly Future” was published in the journal “Frontiers in Conservation. Science”.

It used to be extremely unusual for scientific papers to have such dire titles, but not anymore.

I chat about some of the key findings in this paper. I review some of the abundant evidence that future environmental conditions will be far more dangerous than many people and organizations currently understand. Political and economic systems and leadership do not seem prepared or even capable of action at any scale large enough to even begin to tackle the problem. We need all scientists to speak out candidly and accurately to convey the enormous scope of our dire situation.

I chat about Biodiversity Loss, the Sixth Mass Extinction, Ecological Overshoot (Population Size and Overconsumption), failed international goals and future prospects, climate disruption, political impotence, and how we collectively need to change the rules of the game
———- ———-

The Most Important Topics of the Climate Emergency // Mar 6, 2021

Join Dr. Peter Carter, Paul Beckwith and Regina Valdez as they discuss the most important topics of the Climate Emergency, including climate systems, global warming, water scarcity, food shortages, and loss of sea ice, biodiversity and biomass.

Cast:
Peter Carter
– MD, Expert IPCC Reviewer and the director of the Climate Emergency Institute

Paul Beckwith
– Climate Systems Scientist. Teacher at the University of Ottawa’s Paleoclimatology Laboratory as well as Carleton University

Regina Valdez
– NYC Climate Reality Leader and Mentor. GreenFaith Fellow and LEED Green Associate

Charles Gregoire
– Electrical Engineer, Webmaster and IT prime for FacingFuture.Earth

Heidi Brault
– Organizer and convener. Metadata technician, COP team lead for FacingFuture.Earth
The video was produced by Charles Gregoire and Heidi Brault.

The background music is called “Through the City II” by Crowander.
———- ———-

———- ———-

Please consider donating to support my work. I put a lot of time and effort into researching, studying and producing my videos so that you can learn how quickly our world is changing. Donating does not need a PayPal account, but simply a credit card. Please click here.
———- ———-

Posted in a Climate Change | Tagged , , | Leave a comment

Science Behind a Completely FRESH Arctic Ocean Under a Kilometer Thick Ice Shelf Cap

Science Behind a Completely FRESH Arctic Ocean Under a Kilometer Thick Ice Shelf Cap: Part 1 of 2 // Mar 5, 2021

I delve into the details of the science behind the remarkable new finding that the entire Arctic Ocean was essentially fresh water trapped beneath kilometer thick ice shelves that extended from Arctic coastlines to essentially create a thick ice cap over the entire Arctic Ocean, extending from the landlocked Bering Strait region all the way across the Arctic region to the Greenland-Scotland Ridge.

The scientific evidence behind this incredible finding is very strong. Within salty sea water, there is naturally occurring dissolved uranium, with concentrations proportional to the dissolved salt content. This uranium decays to Thorium-230 which then goes into the seafloor sediments close to the site of production. There is also Calcium, and Manganese, and Sulphur in the salts. During the time periods when the Arctic Ocean was fresh water, with no salt content, these components drop to near zero levels.

How could this happen?

  • With global sea levels 130 meters lower, and a sea ice shelf cap over the Arctic nearly 1 km thick, connections to the other oceans were basically closed off.
  • Over thousands of years, the freshwater discharge into the Arctic Ocean, estimated at 1,200 cubic kilometers per year (20% of Amazon River discharge) filled the Arctic volume under the ice shelf cap, forcing out all the salt water.
  • Amazing stuff. Not only that, but as the glacial periods ended and the ice shelves receded, the 9 million cubic kilometers of fresh water under the Arctic cap was rapidly released to the Atlantic Ocean and then later the Pacific Ocean, causing abrupt global climate system lurches.

———- ———

Science of a Completely FRESH Arctic Ocean — Thorium-230, Calcium, Beryllium-10: Part 2 of 2 // Mar 5, 2021

Second of two videos, here.
———- ———-


———- ———-

———- ———-

Please consider donating to support my work. I put a lot of time and effort into researching, studying and producing my videos so that you can learn how quickly our world is changing. Donating does not need a PayPal account, but simply a credit card. Please click here.
———- ———-

v

Posted in a Climate Change, Uncategorized | Tagged | Leave a comment

Profound Implications of a Completely Salt-Free Arctic Ocean as Recently as 60,000 Years Ago

Profound Implications of a Completely Salt-Free Arctic Ocean as recently as 60,000 Years Ago // Feb 28, 2021

A ground-breaking new finding in climate recently just occurred, and it seems blindingly obvious, in retrospect. In fact I became very close to figuring this out all by myself, many years ago.

During extremely cold, long duration ice ages, at two different periods in the last 150,000 years; namely (a) 60,000 to 70,000 years ago, and (b) 130,000 to 150,000 years ago; the entire Arctic Ocean was fresh liquid water, entombed underneath a thick ice layer, and separated from the Pacific Ocean by land, and from the Atlantic Ocean by a combination of land and grounded ice shelves, with only small passages where fresh water would exit, keeping salt water from entering. How was this possible?

During these exceptionally cold, long duration cold periods there was so much water stored within the glacial ice that global sea levels were lower by 130 meters (430 ft). With sea levels this low, the Bering Strait sea floor became dry land, as well as all the gaps within the Canadian Archipelago and the Nares Strait. There was no water channel connection to the Pacific Ocean at all.

  • On the Atlantic Ocean side of the Arctic, the ocean passages become greatly reduced by the lower sea level exposing the continental shelves.
  • Very thick ice sheets on Greenland and Europe created extensive ice shelves on the coastlines that extended far out into the Arctic Ocean, and these ice shelves, up to 900 meters thick (90 meters above sea level, 810 meters below sea level) almost completely blocked off the remaining ocean passages between the Arctic Ocean and the Atlantic Ocean, between Greenland and northern Scotland.

kkk

Lots of fresh water still entered the Arctic Ocean, from meltwater, northern rivers, rainfall, and snow melt. Therefore, over time freshwater built up in the Arctic Ocean basin, floating above and eventually forcing out the remaining salt water near the ocean floor.

  • Clearly, this led to an entirely fresh Arctic Ocean.

When these ice ages ended due to Milankovitch Cycle changes in Earth’s orbit around the Sun, and the Earth started warming, the sea level rose again and the ice shelves thinned, releasing huge amounts of fresh water back into the Atlantic Ocean and then the Pacific, causing enormous wrenching temperature swings and abrupt climate oscillations until the climate system again reached stability.

  • The Arctic Ocean once again became a salty ocean.

Wow!!!

One of my subsequent videos goes through the peer reviewed paper [1] on this with a fine toothed comb…

Ref:  [1]  The Arctic Ocean was covered by a shelf ice and filled with freshwater, February 3, 2021. Alfred Wegener Institute, Helmholtz Centre for Polar and Marine Research:

The Arctic Ocean was covered by up to 900 m thick shelf ice and was filled entirely with freshwater at least twice in the last 150,000 years. This surprising finding is the result of long-term research. With a detailed analysis of the composition of marine deposits, the scientists could demonstrate that the Arctic Ocean as well as the Nordic Seas did not contain sea-salt in at least two glacial periods.

‘Instead, these oceans were filled with large amounts of freshwater under a thick ice shield. This water could then be released into the North Atlantic in very short periods of time. Such sudden freshwater inputs could explain rapid climate oscillations for which no satisfying explanation had been previously found.

Ref 2:  Physics.org, similar link.

Ref 3:  Thorium-230.
———- ———-

Beckwith Updates and Lead-in to an Amazingly Awesome New Finding on a Completely Fresh Water Arctic // Feb 27, 2021

I just filmed a whole bunch of videos on the Arctic.

This video is kind of an overall series introduction, where I discuss some personal stuff in my life, the awesome books that I am reading, and then the Arctic. Basically I am just shooting the breeze, but I think you will find some interesting nuggets and hints on an enormously significant new finding. Namely, from about 60,000 to 70,000 years ago, and from 130,000 to 150,000 years ago, the Arctic Ocean basin was composed of completely fresh water, with the frozen ice on the surface.

How is this possible. Stay tuned; lots of videos to follow!!

Ref: Stephan King, Sleeping Beauties, The Case for Mars: The Plan to Settle the Red Planet and Why We Must, Bill Gates, How to Avoid a Climate Disaster: The Solutions We Have and the Breakthroughs We Need, Our Final Warning: Six Degrees of Climate Emergency,
———-

———- ———-

Please consider donating to support my work. I put a lot of time and effort into researching, studying and producing my videos so that you can learn how quickly our world is changing. Donating does not need a PayPal account, but simply a credit card. Please click here.
———- ———-

Posted in a Global Warming, Uncategorized | Tagged , , , | Leave a comment

Review: Arctic Temperature Amplification Influence on Polar Vortex Causing Severe Winter Weather

Review: Arctic Temperature Amplification Influence on Polar Vortex Causing Severe Winter Weather // Feb 18, 2021

In my last few videos I discussed the brutal cold snap that has extended downward in the USA, as far south as the Mexican border and the Gulf of Mexico. It temporarily wiped out about 1/3 of the Texas power grid, plunging 4.5 million Texas households into extended cold and darkness. If you assume that each household has an average of 3 people, that’s 13.5 million people. As bad as it was, it came very close to knocking out the entire state power grid.

In this video I get into the scientific details on how abrupt climate system change has warmed the Arctic much faster than the lower latitudes (Arctic Amplification) and this in turn is leading to frequent disruptions of the polar vortex. I discuss a review paper that examines the various process that lead to observations of slowing and wavier (more meridional) Jet Streams, which are in turn leading to more likely Sudden Stratospheric Warming which then fractures (splits) the polar vortex causing cold Arctic air to spill far southward in North America and in Eurasia.

  • Essentially, the Arctic is warming like crazy on its own.
  • This warming near the surface and near the troposphere-stratosphere border region of the Jet Streams is rising even higher into the stratosphere fracturing the stratospheric polar vortex.
  • Consequently, the cold Arctic air spills southward.
  • Of course, when you think about it, massive amounts of cold air moving from the Arctic to the deep southern latitudes is simply another manifestation of a greatly warming Arctic, since the cold air lost there in the far North is replaced by warmer air moving into the far north.

Of course, most people have not cared in the least that the Arctic is warming like crazy. However, they do care, even in Texas, when the Arctic breaks and the cold Arctic air spills into their cities and takes out their power grid.

I can guarantee you that people will care, when the broken Arctic disrupts the global air circulation and ocean circulation patterns enough to take out much of the global food supply in the near future, as we plunge towards a total loss of summer Arctic sea ice BOE (Blue Ocean Event).

Ref: ‘Divergent consensuses on Arctic amplification influence on midlatitude severe winter weather‘, December 2019. Nature Climate Change 10(6):1-10 [1]

The Arctic has warmed more than twice as fast as the global average since the late twentieth century, a phenomenon known as Arctic amplification (AA). Recently, there have been considerable advances in understanding the physical contributions to AA, and progress has been made in understanding the mechanisms that link it to midlatitude weather variability. Observational studies overwhelmingly support that AA is contributing to winter continental cooling.

‘Although some model experiments support the observational evidence, most modelling results show little connection between AA and severe midlatitude weather or suggest the export of excess heating from the Arctic to lower latitudes. Divergent conclusions between model and observational studies, and even intramodel studies, continue to obfuscate a clear understanding of how AA is influencing midlatitude weather. Amplified warming in the Arctic has been linked to weather variability in the midlatitudes. This Review considers the evidence from both observations and modelling studies on this link for increasing severe winter weather, including cold temperatures and heavy snowfalls‘.
——— ———-

https://twitter.com/ai6yrham/status/1362468120242262017?s=20
———- ———-

Please consider donating to support my work. I put a lot of time and effort into researching, studying and producing my videos so that you can learn how quickly our world is changing. Donating does not need a PayPal account, but simply a credit card. Please click here.
———- ———-

Posted in a Climate, a Climate Change, a Rapid Climate Change, a Science, a Weather, Catastrophe, Collapse, Public Health, Tragedy, Warnings, z Urgent | Tagged , , , , , , , , , , , , , | Leave a comment

Using Indoor CO2 Levels, Find Out How Much People’s Breath–Virus–You Breathe In

Using indoor CO2 levels to find out how much of other people’s breath (virus) you breathe in: 1 of 2 // Feb 12, 2021

Is it possible to crush coronavirus like a bug? Without devastating lockdowns? Yes, we are all hoping for vaccines, and ones that work for the new strains that are more transmissible. In this video and the next, I make the case for widespread installation of carbon dioxide monitors in all indoor public spaces. We have smoke detectors to warn us and keep us safe from fires. We have carbon monoxide detectors to keep us safe from harm from incomplete combustion heating systems.

We put chemicals that smell like rotten eggs into natural gas to keep us safe from leaks. Now, to fight coronavirus, and all other airborne virus like Spanish flu, SARS, and MERS, and future viruses we need to measure indoor air quality and ventilation. Carbon dioxide is a perfect proxy for real-time measurement of the virus. Outside, virus transmission is extremely low, almost nonexistent with social distancing, and CO2 levels are about 420 ppm (parts per million), on average.

We need to put carbon dioxide monitors inside all schools, long-term care homes, restaurants, stores (i.e. all public spaces) to avoid cyclical lockdowns. If indoor CO2 concentration levels are close to external, say 400 to 600 ppm, the coronavirus transmission risk is extremely low. If they are about 800 ppm, or even higher the transmission risk is much higher. Open windows, ventilate; otherwise clear people out of the room.

At 800 ppm, the rebreathe factor means that 1% of the air you breathe is air that somebody else in the room exhaled. Many public spaces, like schools are often 1000, 2000, even 5000 ppm, and any virus particles in that space will circulate in the air for many hours, even after people have left the room. Perfect for spreading. Measure carbon dioxide as a proxy for real-time virus risk monitoring. Train medical doctors and virologists and engineers on how vital this is. It really is this simple.

Ref 1:  ‘With its five wall-length windows, Nick Crandall’s restaurant, Railroad Pub & Pizza, can bring in a lot of outside air. In late December, though, Washington state regulators said the restaurant could not qualify as “outdoor” dining, and would have to close because of heightened coronavirus restrictions.

‘So Crandall went to Facebook to protest, giving a video tour of the Burlington, Wash., pub and its vast, garage-door-style windows. “I’m just kind of curious on what the science is for outdoor dining, how much airflow you need to do,” he said. He took aim at the state’s Democratic governor, Jay Inslee, suggesting he use “common sense.” The video was viewed over 73,000 times‘.  Article continue here:  The coronavirus is airborne, The coronavirus is airborne. Here’s how to know if you’re breathing other people’s breath, By Chris Mooney.  Feb. 10, 2021 at 5:26 a.m. PST
———- ———-

How much in “Every breath you take” indoors is from somebody else’s previous breaths? 2 of 2 // Feb 12, 2021

Is it possible to crush coronavirus like a bug? Without devastating lockdowns?

Yes, we are all hoping for vaccines, and ones that work for the new strains that are more transmissible.

In this video and the previous one, I make the case for widespread installation of carbon dioxide monitors in all indoor public spaces.

We have smoke detectors to warn us and keep us safe from fires. We have carbon monoxide detectors to keep us safe from harm from incomplete combustion heating systems. We put chemicals that smell like rotten eggs into natural gas to keep us safe from leaks. Now, to fight coronavirus, and all other airborne virus like Spanish flu, SARS, and MERS, and future viruses we need to measure indoor air quality and ventilation.

Carbon dioxide is a perfect proxy for real-time measurement of the virus. Outside, virus transmission is extremely low, almost nonexistent with social distancing, and CO2 levels are about 420 ppm (parts per million), on average. We need to put carbon dioxide monitors inside all schools, long-term care homes, restaurants, stores (i.e. all public spaces) to avoid cyclical lockdowns.

If indoor CO2 concentration levels are close to external, say 400 to 600 ppm, the coronavirus transmission risk is extremely low. If they are about 800 ppm, or even higher the transmission risk is much higher. Open windows, ventilate; otherwise clear people out of the room. At 800 ppm, the rebreathe factor means that 1% of the air you breathe is air that somebody else in the room exhaled.

Many public spaces, like schools are often 1000, 2000, even 5000 ppm, and any virus particles in that space will circulate in the air for many hours, even after people have left the room. Perfect for spreading.

Measure carbon dioxide as a proxy for real-time virus risk monitoring.
Train medical doctors and virologists and engineers on how vital this is.
It really is this simple.

Ref 2:  ‘At a recent live pop concert in Tokyo’s Chiyoda Ward, the large screen set up at the edge of the stage didn’t give the audience a close-up view of the idol or any other eye-catching visual.  Instead, it changed colors to show the carbon dioxide (CO2) level in the air, in an unconventional effort to contain the spread of COVID-19‘.  Article continues at link:

Screens Showing CO2 Level Set Up at Venues to Lessen Virus Risk
By Ryosuke Nonaka:

——— ———-

https://twitter.com/ai6yrham/status/1362468120242262017?s=20
———- ———-

Please consider donating to support my work. I put a lot of time and effort into researching, studying and producing my videos so that you can learn how quickly our world is changing. Donating does not need a PayPal account, but simply a credit card. Please click here.
———- ———-

Posted in Public Health | Tagged , , , , , | Leave a comment

Damage to our Climate and Environment Risks Disruption and even Collapse of our Societies

Damage to our Climate and Environment Risks Disruption and even Collapse of our Societies // Feb 3, 2021

Late last year, literally hundreds of scientists, writers and academics warned us, once again, that policymakers and the rest of society must “engage openly with the risk of disruption and even collapse of our societies.”

Collapse is well underway for numerous species.

  • 99% of tall grass prairie in North America is gone;
  • 96% of the biomass of mammals on Earth is humans, our pets, and our farm animals;
  • nearly 90% of the oceans fish that the United Nations monitors is fully exploited, over exploited or depleted;
  • a multiyear German study shows a 76% decline in insects.

We must have complete public engagement with the unthinkable societal collapse, that is mostly unmentionable in main stream media and most of society.

Not so long ago, it was unthinkable that a virus would shut down nations, and that societal safety nets would price to be disastrously lacking in resilience. Yet, this happened and is ongoing

Ref: Op-Ed: Collapseologists are warning humanity that business-as-usual will make the Earth uninhabitable: By Christopher Ketcham and Jeff Gibbs, JAN. 31, 2021

‘Hundreds of scientists, writers and academics from 30 countries sounded a warning to humanity in an open letter published in the Guardian in December: Policymakers and the rest of us must “engage openly with the risk of disruption and even collapse of our societies.” “Damage to the climate and environment” will be the overarching cause, and “researchers in many areas” have projected widespread social collapse as “a credible scenario this century.”
———- ———-

———- ———-

Please consider donating to support my work. I put a lot of time and effort into researching, studying and producing my videos so that you can learn how quickly our world is changing. Donating does not need a PayPal account, but simply a credit card. Please click here.
———- ———-

https://twitter.com/atrupar/status/1357492435253870593?s=20
https://twitter.com/SethAbramson/status/1357463273709457420?s=20

Posted in a Climate, a Global Warming, Catastrophe, Warnings | Tagged | Leave a comment

Musings: Acceleration of Global Ice Loss, Feedbacks, and Biden’s Executive Actions on Climate Change

Musings: Acceleration of Global Ice Loss, Feedbacks, and Biden’s Executive Actions on Climate Change // Jan 27, 2021

A few days ago a landmark scientific review paper was published on Earth’s Global Ice Imbalance. The major findings of this satellite observational work is my primary focus in this 3 part video series, but mostly appears in video Parts 2 and 3.

In Part 1 (this video) I mostly chatted about some of what I have been up to the last few weeks (C++ programming, reading fiction and nonfiction, shoveling snow, plumbing and boiler repairs, etc.).

Also, I chatted briefly about some of Biden’s awesome Executive Actions on climate change, Feedbacks in the Earth System, and my plans for future videos on Peter Carter’s Climate Emergency Institute work. Regarding Earth’s Global Ice Imbalance, the Earth lost 28 trillion (million million) tons of ice between 1994 and 2017.

This loss in trillions of tons was:

  • 7.6 from Arctic Sea Ice,
  • 6.5 from Antarctic Ice Shelves,
  • 6.1 from Mountain Glaciers,
  • 3.8 from the Greenland Ice Sheet,
  • 2.5 from the Antarctic Ice Sheet, and
  • 0.9 from Southern Ocean Sea Ice.

58% of the ice loss was from the Northern Hemisphere, with 42% from the Southern Hemisphere.

In the 1990s the yearly loss averaged 0.8 trillion tons, rising to 1.2 in the 2010s. Loss of grounded ice from Greenland and Antarctica and Mountain Glaciers rapidly increased global sea level rise.

68% of global ice loss is caused by atmospheric heating, with 32% caused by oceanic melting driving ice sheet discharge and ice shelf thinning and calving. The global melt of ice around the planet only took up 3.2% of the total global energy imbalance.
———- ———-

———- ———-

Please consider donating to support my work. I put a lot of time and effort into researching, studying and producing my videos so that you can learn how quickly our world is changing. Donating does not need a PayPal account, but simply a credit card. Please click here.
———- ———-

Posted in a Climate, a Climate Change | Tagged , , , , , | Leave a comment

Global Average Temperatures in 2020 Reached a RECORD HIGH of 1.55 C above PreIndustrial in 1750

Global Average Temperatures in 2020 Reached a RECORD HIGH of 1.55 C above PreIndustrial in 1750 //  Jan 16, 2021

The numbers are out, and they are not pretty. Global average temperature in 2020 was 1.25C above the turn-of-the-previous-century average (1880-1910), thus set a new record for the warmest year.

Relative to the year 1750, you need to add 0.3C for the baseline shift, so 2020 was actually 1.55C warmer than 1750, which is termed the real pre-industrial, and the Paris climate agreement in 2015 had numerous countries promise to strive to work together to keep this global average rise, relative to preindustrial (1750) below 2C, with aspirations to stay below 1.5C.

Thus, 2020 blew past the 1.5C number, hitting 1.55C.

What is amazing about this is that is happened in the year of the coronavirus industrial shutdowns, in which global greenhouse gas emissions from burning fossil fuels decreased by about 7%.

Also, 2020 was a weak La Niña year. The effect of this ENSO (El Niño Southern Oscillation) La Niña depressed global temperatures by an estimated 0.1C (my estimate). This, if 2020 was ENSO neutral, the global average temperature would have hit 1.65C.

Even worse, if 2020 had been a strong El Niño year, add 0.2C to that temperature (by my estimate). This would have resulted in global average temperature hitting 1.85C higher than 2050, by my best estimate. This will happen, no doubt, in a few short years when we have another powerful El Niño similar to that in 2015-2016 which caused us to have the record setting temperature year that was just broken in 2020.

Climate warming is spiraling out of control. We urgently must deploy my so called three-legged barstool solution triage:

1) Slash fossil fuel emissions.
2) Remove CO2 and methane from the atmosphere/ocean system (CDR).
3) Deploy Solar Radiation Management (SRM) technologies to cool the Earth.
We could quickly do these emergency things by using the 700 to 900 billion $US military budget and defense industry scientists and engineers to work on these last ditch solutions to stabilize climate. Without this, our global food supply will be crushed like a bug within the next 5 to 10 years, causing global strife.

Ref:  2020 was Earth’s 2nd-hottest year, just behind 2016, January 14, 2021:
It’s official: 2020 ranks as the second-hottest year on record for the planet, knocking 2019 down to third hottest, according to an analysis by NOAA scientists.

———- ———-

———- ———-

Please consider donating to support my work. I put a lot of time and effort into researching, studying and producing my videos so that you can learn how quickly our world is changing. Donating does not need a PayPal account, but simply a credit card. Please click here.
———- ———-

Posted in a Climate, a Climate Change, a Global Warming, a Rapid Climate Change, Outdoors, Winter Muse, z Paul's Walking Talks | Tagged , , , , , , , , , , , | 1 Comment