Comparing Methane Levels from Copernicus, MetOps, and Ground Data: 1 of 2 // Dec 12, 2018
Methane levels are rapidly increasing globally. Methane release in the Arctic from thawing terrestrial and marine permafrost, and from methane clathrates on shallow continental shelves are a huge and ever increasing risk.

- I compare and contrast methane observations from satellites (Copernicus and MetOp1) and from
- Ground flask measurements to see what is happening now;
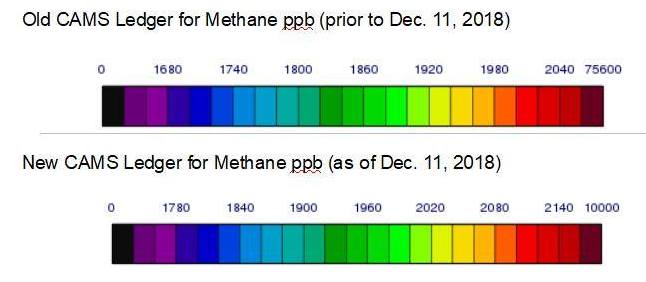
- I chat about the colour legend change for the Copernicus data,
- which was offset by 100 ppb, and what that means, and why.
Link to See More Rocks post, Large heat anomalies in Pacific Right Now by Robin Westenra [Addenda, Fri 13-Nov: Reconsidering the large increase in methane emissions].
Link to Trends in Atmospheric Methane, NOAA.org.

———- ———-
Global Methane Rise Literally Off-the-Charts: 2 of 2 // Dec 12, 2018
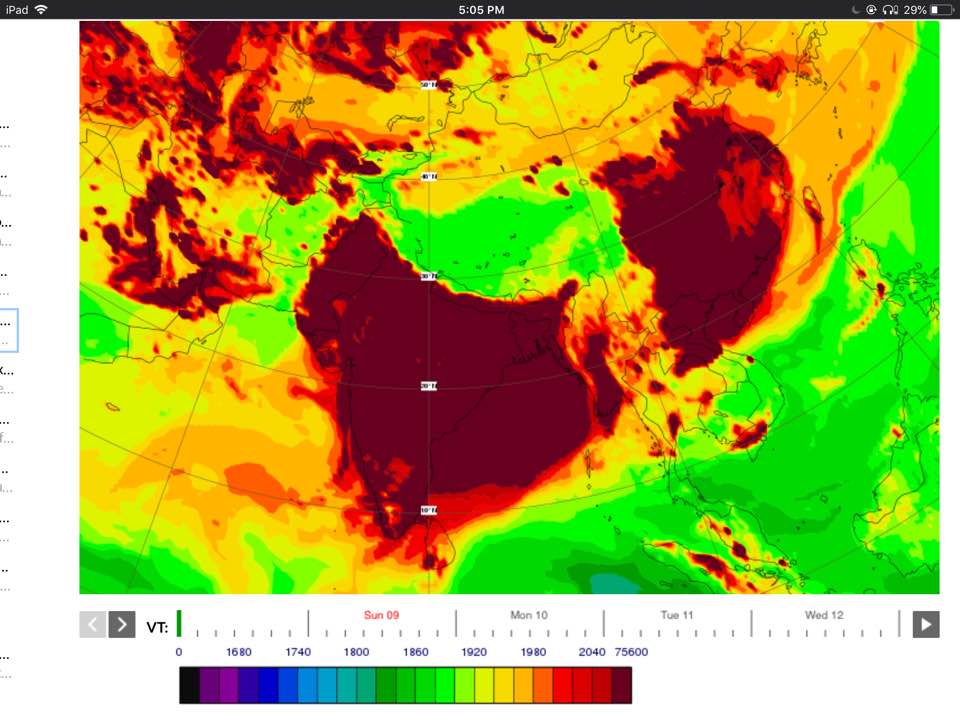
The unrelenting increase in global levels of atmospheric methane went literally off-the-charts used to display methane for the Copernicus Atmospheric Monitoring Service (CAMS). Methane levels were so high that:
- They swamped out the colour scheme used in the map legend,
- Causing saturation in large red blobs with little detail.
- The colour legend was shifted by 100 ppb to more clearly show the detailed structure of where methane was being emitted.
I strive to maintain scientific independence so that I can always present you with the total unvarnished truth about our rapidly changing climate system and the dangers that we face. I rely on your generous donations to do this, so please consider donating for my efforts.
———- ———-

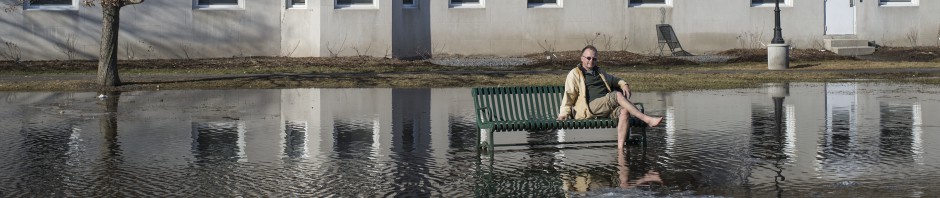
Beckwith at Paris COP21 in 2015.
Wishing now, that he was in
Poland this year at COP24
———- ———-
———————————-
Please consider donating to support my work. I put a lot of time and effort into researching, studying and producing my videos so that you can learn how quickly our world is changing. Donating does not need a PayPal account, but simply a credit card. Please click here.
———- ———-
———- ———-
Videos on learning and neuroscience, from Nov 30th, Dec 2nd, and Dec 3rd, 2018 respectively:

