
I took the day off to break ice, shop, get my hair cut, and see friends. What a day to take off:). I stand by both of my videos released on February 29th on the California gas emissions on the major fault lines.
In my opinion NASA’s explanation below makes no sense whatsoever. I am actually amazed that this was claimed, since to me it is not consistent with the images. Obviously, I will generate more videos to support my views. For starters:
1) They only mention CO, and say nothing about CO2 and SO2.
2) The emissions are spatially located over the fault-lines; how could fires aggregate in these regions?
3) There was an Earthquake in New Zealand around Feb 29th that showed CO release.
4) They are trying to say the error was just over California. Really? Was the data wrong over the whole globe?
5) I discussed the idea of “instrumentation error” in my second video yesterday. In my opinion, the explanation from NASA does not address any of the points in my video, which I stand by 100%.
If NASA had said that there was a gamed simulation that got into the data set that would have seemed more realistic to me–still implausible, in my opinion, but harder to prove wrong. Facebook friends and others, please help me out by doing the following:
A) Go to the USGS site and pick an Earthquake that occurred within the last few months, say over 5 and anywhere in the world.
B) Go to Earth NullSchool and look at the CO, CO2 and SO2 data for a few weeks before and after the quake.
C) Share your findings, positive or negative below this post and throughout social media.
D) Do it quickly, in case the Earth NullSchool site is potentially compromised.
Thanks. The fact that NASA is claiming “instrumentation” makes me think even more that my videos are correct. Remember that I am not claiming that a quake will occur. See the conclusion of my second video yesterday to hear my thoughts.
———- ———-
Why was nothing said at all for five days? By NASA, scientists, satellite engineers, climatologist? Why was nothing said at all?
———- ———-
[Addendum, update by Paul, 12:44 am Wed, dk:]
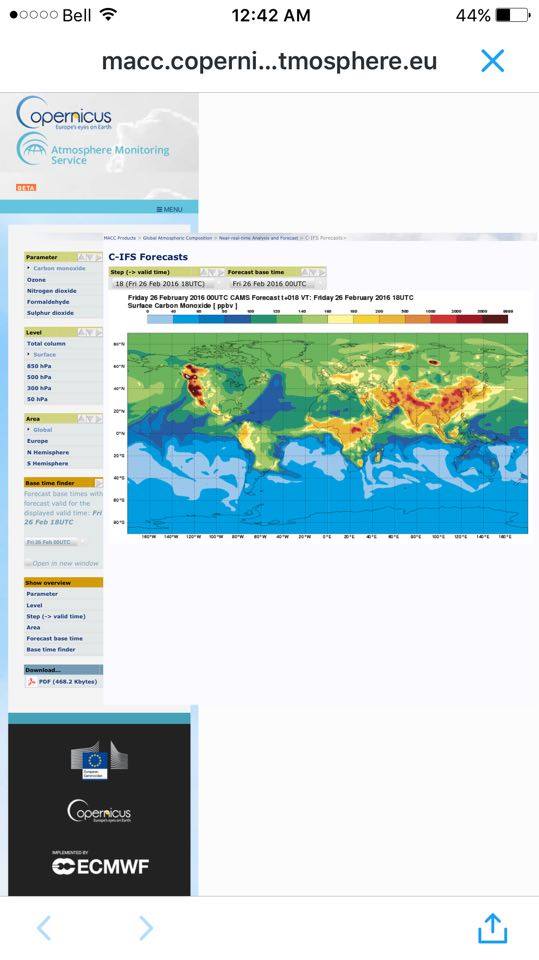
Europe satellite shows high CO in California as well. Beckwith 1: NASA 0.
Link to Euro satellite:
@mtflis @aHEM_again @ClimateOfGavin @SJvatn Is your instrument also wrong over Beijing??? #climate #climatechange

Beijing is above image… These emissions from Beijing must be real, no…
[Addendum, 3:14 am Wed, highlight helpful comment: ‘Just a quick tip: Scrolling day by day, one at a time, on earth.nullschool.net is tedious, and self-defeating. Data from earth.nullschool has been saved almost every day since at least 2014 on the Wayback Machine (archive.org). So, go here: Internet Archive, Wayback Machine for Earth NullSchool. and find the date you are researching (or a date close to it) and it will bring you to that specific day’s data/map…‘ // dk. Thanks Triquetra331!]


I stand by you Paul, I know you’re right, you most often are.
Keep fighting!
Jack
LikeLiked by 1 person
Has a timeline been developed between the time of the first releases of CO, CO2 and SO2 and potential earthquakes? Should I be stocking food and water now?
LikeLike
Paul, is it possible that the gas emissions could be related to the capping of the Porter Ranch (Aliso Canyon) leak? On February 18th, the leak was officially declared as sealed. Is there a possibility that it may have resulted in another leak that breached the San Andreas fault and released gas into the fault? If so, would it make it a short term event caused by faulty underground storage that could resolve itself without material climatic effect?
LikeLike
Probably not because remember this happened all up the west coast up through British Columbia and even on the east coast of Asia, thought the plumes in Asia were not as bad.
LikeLike
There must be more measurements of CO etc than just the GEOS-5 satelite measurements. At groundlevel, do measurements confirm the nullschool-presentation readings ? I think more data for the effected area from february 25 is needed.
LikeLiked by 1 person
Please see here about ground level measurements:
http://tinyurl.com/zz9ckr5
LikeLike
Just a quick tip:
Scrolling day by day, one at a time, on earth.nullschool.net is tedious, and self-defeating.
Data from earth.nullschool has been saved almost every day since at least 2014 on the Wayback Machine (archive.org)
So, go here: http://web.archive.org/web/20160615000000*/http://Earth.nullschool.net
and find the date you are researching (or a date close to it) and it will bring you to that specific day’s data/map…
BTW: Glad my links👆🏻 (from YouTube) were helpful!
LikeLike
Trying to cross reference some 6.5+ events with the Wayback Machine proves to be unsuccessful. Most of the snapshots don’t have the CO overlays or the dates aren’t correct.
LikeLike
It’s a strange, but interesting, adventurous world we live in. About point 1) “They only mention CO, and say nothing about CO2 and SO2”. Actually, the NASA statement says:
“… unrealistic emissions derived from satellite observations of fires, which led to elevated concentrations of atmospheric CO (as well as other species).”
http://gmao.gsfc.nasa.gov/news/geos_system_news/2016/incorrect_CO_concentrations.php
About that EuroSat Copernicus measurements: I have seen it yesterday in a youtube vid already. What baffles me a bit is the fact, that, at 26.2.2016 they had a very high reading of CO all over the westcoast up to Alaska (as you can see in the graphic above), but there isn’t such high spike of CO all over the westcoast at nullschool for that day. Have you guys any clue why that is?
Question:
Is NASA “lying” or don’t they know their very own instrumentation?
Respect
LikeLike
Sorry for doublepost. Why isn’t there any report of such high CO from any ground stations?
Thanks
LikeLike
The satellite on which MOPITT is installed takes 3 days to cover the entire planet and was restarted late on the 25th. Read this:
http://oftechandlearning.com/bad-data-carbon-monoxide-eruption-not-real/
Maybe the satellite did not cover that area of western Alaska on the 26th. Kinda hard to say..
LikeLike
Could the recent earthquake of magnitude 7.8 off Sumatra be related to the gas release? It was pretty much on the opposite side of the Pacific tectonic plate? If so, then perhaps there might be more earthquakes on the way in that region.
LikeLike
Very informative article about the subject can be found here:
http://oftechandlearning.com/bad-data-carbon-monoxide-eruption-not-real/
Also notice the comment section!
Important:
Copernicus uses the same input data as NASA:
http://atmosphere.copernicus.eu/cams-input-data
LikeLiked by 2 people
Thank you. Helps A LOT.
LikeLike
I am pretty convinced by these links it is instrument error. From what I understand the fact that the animation shows the gases dissipate eastwards is due to the atmospheric models that are used. The satellites takes 3 days to cover the entire planet, so what one sees on nullschool when going +3 hours ( by clicking > ) is extrapolation by these models, it is not measured data. The dissipation effect is an illusion.
LikeLike
Nick, you’re exactly right regarding the extrapolation.
LikeLike
If this is the case (and please correct me if I’m completely off track) then every 3 days the model will be based (possibly even recalculated?) on a new real dataset as opposed to extrapolated and one would have also thought the historical extrapolated data would/should/could be recalculated and smoothed back in time from the new dataset. Why is that 2 datasets later there is still quite a lot of CO in the atmosphere above California. The sensor in question should now be recording correctly and not its own “overheated” IR signal…
Does the same sensor detect CO, CO2 and SO2 or are they separate sensors. Will all sensors be compromised if one is a little hot?
LikeLike
When I look at the comment sections of some youtube videos about that allegedly CO spike over California, I see exactly the same stupid crap, I see from hardcore, anthropogenic climate change deniers. Examples:
“ if anyone today still believes anything that comes out of NASA or any other government alphabet gang, u need to wake up!!”
“ NASA lies, over and over and over. SMOKING GUN !!! NASA CAUGHT RED HANDED!!! Lying Bastards!”
That’s really bad, in fact, that’s just sick. You can find countless claims like that all over the internet. That’s surely not, what you want, Mr. Beckwith, right? I learned a lot from all your videos so far, so please keep up the good work!
Cheers
LikeLiked by 1 person
I try to track the State’s fires, being as I live here in the high fire zones of California…I was surprised that NASA mentioned something about fires being part of the aberration in measurements. I am still searching for those fires. They must be huge, especially when compared to the Butte and Valley fires of last year. Gosh where are those pesky fires!
LikeLike
So, what do you think, is NASA lying or hiding something or don’t they understand their very own model output?
LikeLike
adinateyseng53,
NASA’s statement isn’t restricted to forest fires. Controlled burns in wilderness areas, or agricultural burns of old orchard trees would also qualify. In fact, any fire source emitting CO would be picked up. Normally these relatively small sources of CO would appear insignificant in GEOS-5 model outputs.
The MOPITT instrument responsible for the bad readings works by sensing a very narrow band of infrared light, which makes it very sensitive to changes in operating temperature. At the time of its bad readings, MOPITT was not at its optimum operating temperature. My guess is it was still warming up after the Terra satellite went offline for several days. Based on the GEOS-5 data, it appears that MOPITT was overly sensitive to small amounts of CO. That is, because MOPITT was still warming up, it was erroneously amplifying the magnitude of its CO measurements.
LikeLiked by 1 person
I will check that out. Thank you. That seems more plausible. Anyone else have thoughts on this? However, from what I know, agricultural burns are highly controlled and permitted in California. In fact there are systems for the detection of illegal fires over much of the state. All controlled wilderness burns are reported to Calfire. I checked and their reported burns were below the average for Feb 26. These are my observations only and definitely nothing more than anecdotal.
LikeLike
adinateyseng53,
NASA’s statement isn’t restricted to forest fires. Controlled burns in wilderness areas, or agricultural burns of old orchard trees would also qualify. In fact, any fire source emitting CO would be picked up. Normally these relatively small sources of CO would appear insignificant in GEOS-5 model outputs.
The MOPITT instrument responsible for the bad readings works by sensing a very narrow band of infrared light, which makes it very sensitive to changes in operating temperature. At the time of its bad readings, MOPITT was not at its optimum operating temperature. My guess is it was still warming up after the Terra satellite went offline for several days. Based on the GEOS-5 data, it appears that MOPITT was overly sensitive to small amounts of CO. That is, because MOPITT was still warming up, it was erroneously amplifying the magnitude of its CO measurements.
LikeLike
I wish I knew. The Twitter statement seem to be very vague. I would hope they are being honest and I can be less worried. So many government agencies have been less than forthright about issues relating
to climate and emissions. These are institutions I look to for accuracy and a relative degree of honesty, after taking into consideration the political atmosphere they have to exist in. Their statement implied some sort of fire related problem with their measurement without explaining what that meant. I would have liked something more than a “tweet.” And still looking for those fires.
LikeLike
Has anyone found anything interesting regarding CO spikes and previous quakes? I talked to a seismologist who said that they don’t even monitor CO because they don’t consider it a possibility.
Also, my wife and I both experienced serious lack of oxygen and shortness of breath at about 1 AM on Monday morning. We knew nothing about any CO spikes and we both noticed it independently of each other. My wife compared it to being up at 9,000 feet elevation. Just a lack of oxygen. We instantly worried about a Carbon Monoxide leak in the house but no alarms were going off. I opened a window to get some fresh air and while cooler air blew into the room…we both still felt reply short of breath. The dead air was outside as well.
I have talked to several other people on the west coast that have experienced the exact same thing.
LikeLike
Somewhere in the info on the “Instrumentation glitch” there was mention that it take 3 days to collect data to cover the globe with the satellite in question. It is now the 3rd of March and there is still large amounts of CO observed in California on the Nullschool site which would suggest 2 new sets of data have been collected over California. and fed into the model. If the temperature of the sensor was an issue – “stabilizing” – as suggested on one blog site, I’d argue that the trends in the data are probably still OK but maybe not accurate i.e. could be well below the 40000ppb recorded but still likely elevated above normal – surely the model isn’t that bad given the concentrations recorded over China don’t affect the algorithm… just a thought.
With regard to the CO release in New Zealand on the 29th Feb related to possible quake (I assume you mean the little ‘plume’ in the central south island??), I would argue this is more likely associated with incomplete combustion. At the moment we have large amounts of post-harvest stubble burn-off from grain farms in Canterbury (East coast, central South Island) while we have a southerly airflow induced cooler weather window (Can’t do it with NW airflow as its hot and dry and a recipe for disaster). It’s entirely possible that our recent weather patterns, wind directions and the relationships between high/low pressure systems look to be ‘sweeping’ that smoke up and possibly causing elevated CO compared to normal right now.
Best regards,
Craig Anderson, Biogeoscientist, Plant and Food Research, New Zealand.
LikeLike
The large gas concentrations observed on Nullschool in California (southern) are the remnants of the incorrect CO measurements still being diffused out by the model calculations. Once the bad data was incorporated into the GEOS-5 model, the model pushes the gas around and thins it out based on wind and temperature data. The model can tell the difference between good and bad data. It just takes what it was given and crunches numbers. So the gas concentrations you see now are not from new data, it’s still the old, bad CO data slowly being dissipated.
Think of it like dropping a drop of red food coloring into a bathtub full of water. You put one drop in, and at first, the red is all concentrated in one small area. Come back in a day and the water might look light pink. No new food coloring was added, but you can still see the effects of the first and only drop of coloring that was added the day before.
LikeLike
Here is a timelapse of CO data from 07/25/15 – 03/02/16. As you can see Beijing is pretty consistently “hot”. The Terra satellite apparently has a fairly narrow field of view and that accounts for only the West Coast lighting up.
The remaining problems are:
1. NASA still hasn’t finished re-running tests to definitively say that it was a malfunction (unless I missed it).
2. There are quite a few first hand reports of mild CO exposure on the West Coast…my wife and I are one of them. You can read about our experience in a comment above. Our experience alone is enough for me to at least believe something wasn’t quite right at the time of the malfunction. Our story obviously isn’t enough to base…anything on but others have told me about similar experiences since I first shared this.
3. The earth null site appears to stop showing CO data around 07/25/15. The only really crazy emission is the one that happened last week. The question should be, has there EVER been another emission of that magnitude (or close)? The ’09 quake that brought about the paper from Ramesh Singh seemed to be a big enough spike to cause him to at least propose it as a possibility. How big of a spike was that one? Was that the only other case of such a large spike until the one this last week??
LikeLike
Interesting statement from Professor Ramesh Singh (who did the paper about carbon monoxide and an earthquake in India in 2001):
“ Chapman University Professor Ramesh Singh says it is not linked to an imminent earthquake.
He says he unknowingly got involved in the inaccurate claim because of an article he published years ago. The professor analyzed a spike in carbon monoxide just before a quake in India in 2001, killing thousands of people.
But he says that study has nothing to do with the image of elevated carbon monoxide in the U.S. this year.
“I said: ‘Hey what people are doing?’ They are digging out my paper, they are relating this, and the whole public is getting scared,” Singh says.”
http://losangeles.cbslocal.com/2016/03/03/nasa-satellite-image-with-claims-of-imminent-quake-triggers-scare/
LikeLike